Available Charts
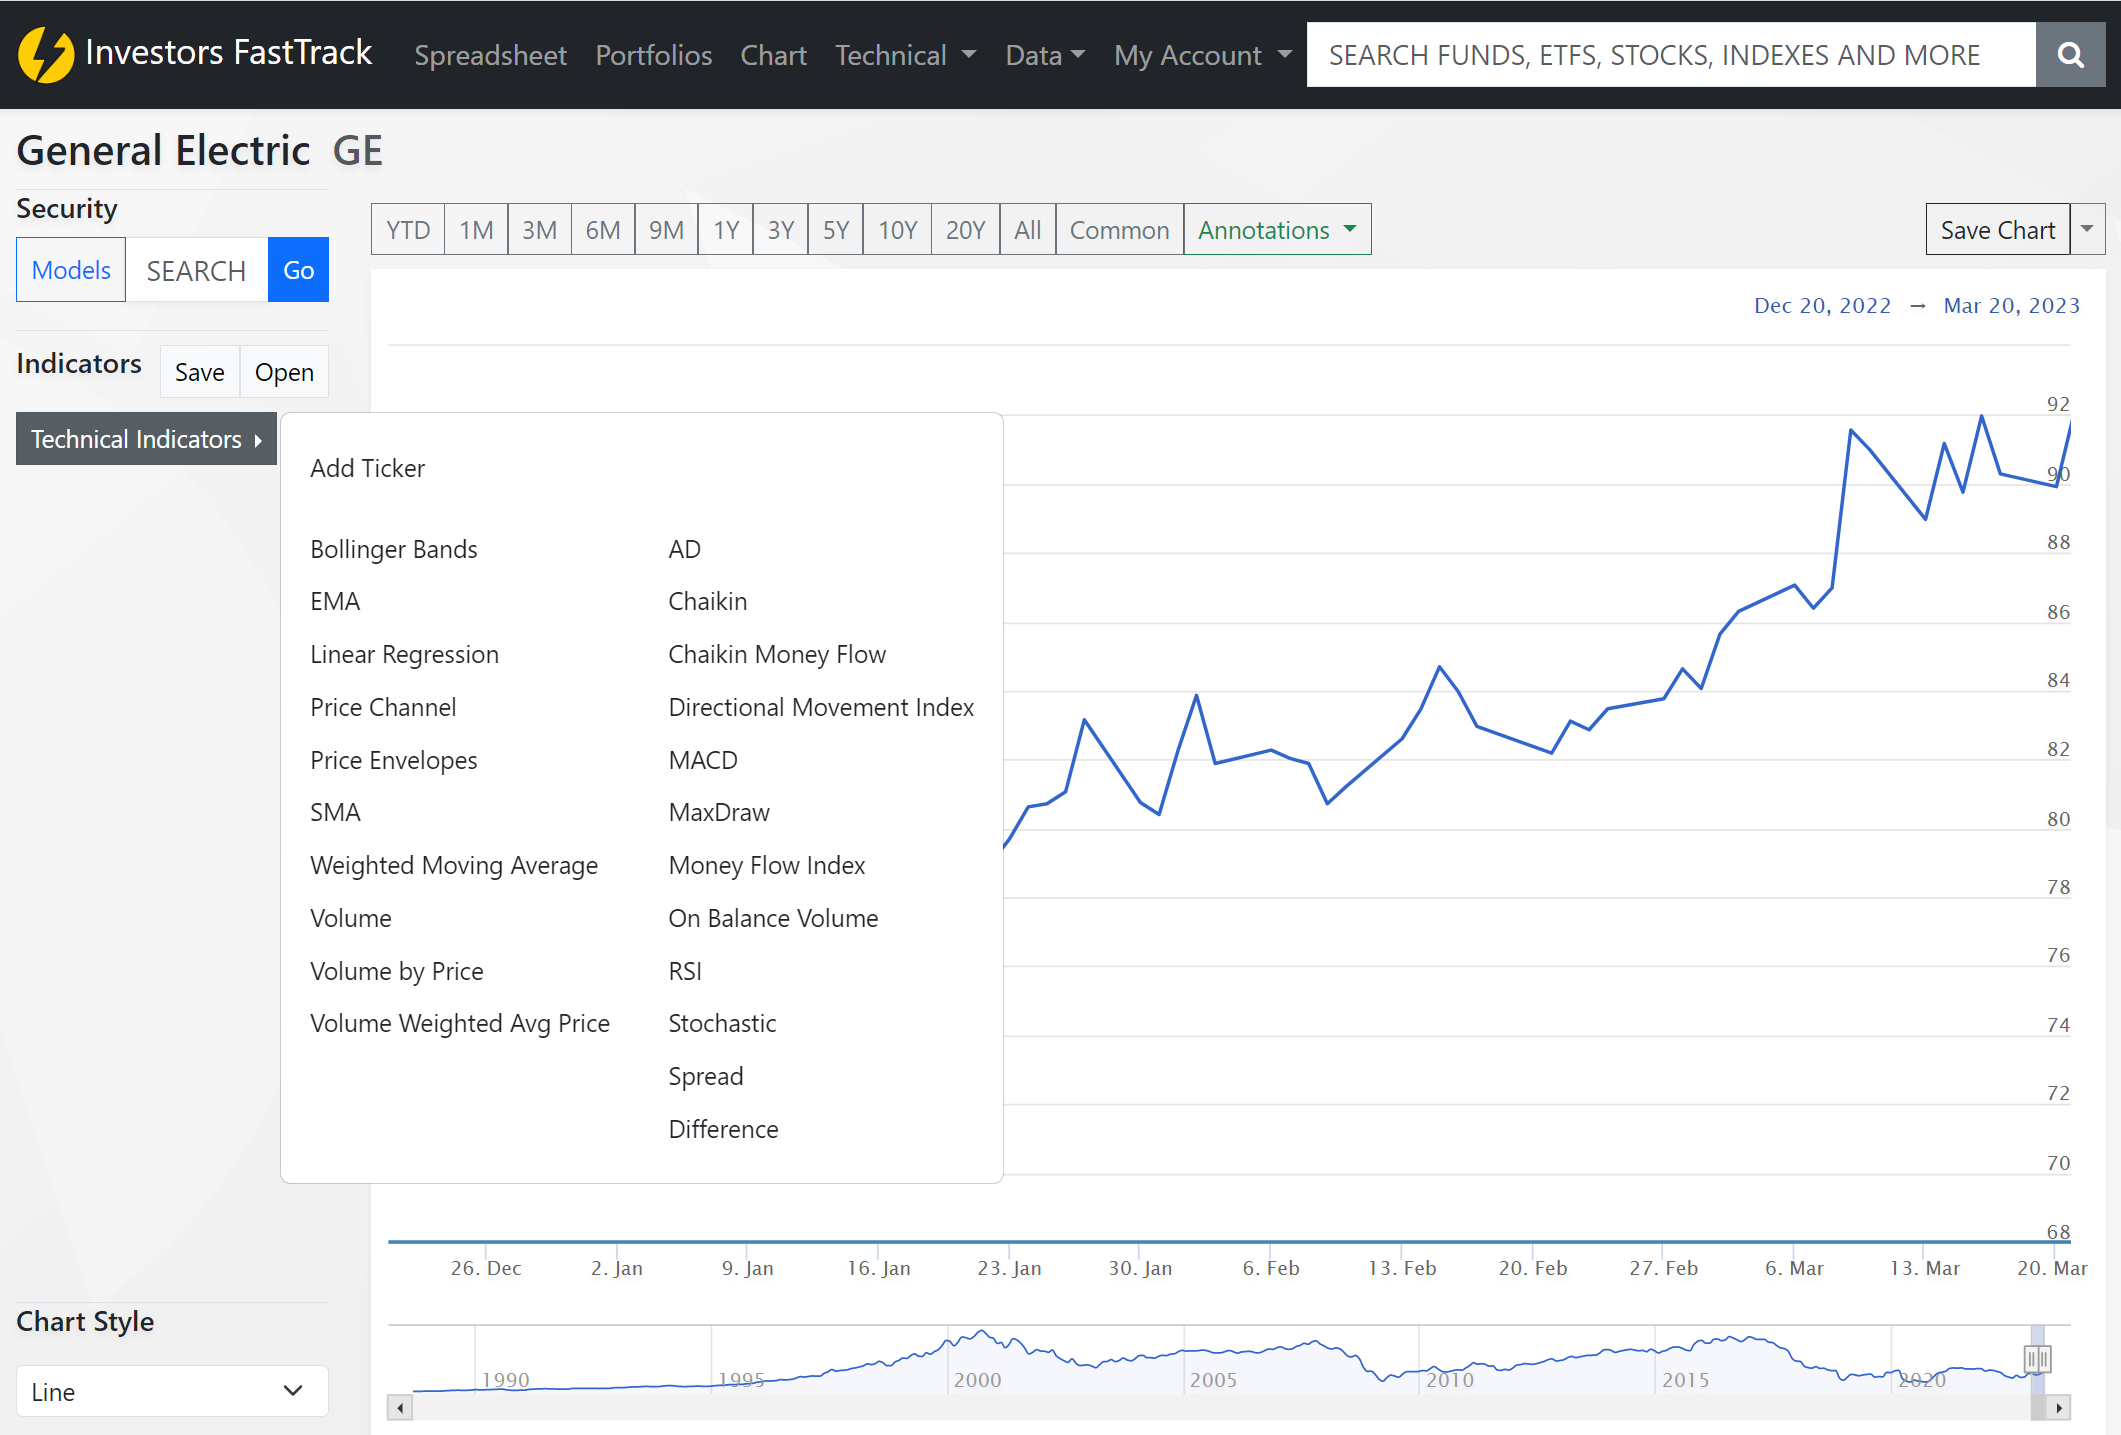
FT Cloud has a variety of Technical charts available and they are described below.
Add Ticker
Accumulation/Distribution Chart (AD)
Definition
An Accumulation/Distribution (A/D) chart is a technical analysis tool that measures the flow of money into and out of a security over a specified time period. It is used to identify potential buying and selling pressure, and to predict potential trend reversals.
A/D charts are based on the theory that the more volume that is traded at a particular price, the more influential that price level is in determining the direction of the security's price.
Usage
When the A/D line is moving up, it may indicate an uptrend, while a downward slope may indicate a downtrend. Traders and investors may use A/D charts to identify potential buy or sell signals when the A/D line crosses certain thresholds or diverges from the price line.
A common buy signal for the AD Line chart is when the AD Line starts to move up after a period of consolidation or decline. This indicates that there may be more buying pressure in the security, and it may be a good time to consider buying the security.
Conversely, a common sell signal for the AD Line chart is when the AD Line starts to move down after a period of consolidation or growth. This indicates that there may be more selling pressure in the security, and it may be a good time to consider selling the security.
Interpretation
When the A/D line is moving up, it indicates that more money is flowing into the security than out of it, which may be indicative of bullish sentiment. Conversely, when the A/D line is moving down, it indicates that more money is flowing out of the security than into it, which may be indicative of bearish sentiment.
A/D charts can also be used to identify potential support and resistance levels. When the price line of a security crosses above or below the A/D line, it may indicate a potential change in the direction of the trend.
The AD Line takes into account both the price and volume of a security, and it can provide insights into the strength of a trend, as well as potential trend reversals. Specifically, the AD Line can be used to:
Confirm the strength of a trend: If the AD Line is moving in the same direction as the price of the security, it can confirm the strength of the trend.
Identify potential trend reversals: If the AD Line is moving in the opposite direction of the price of the security, it may indicate a potential trend reversal.
Identify potential buying or selling opportunities: If the AD Line is moving in the same direction as the price of the security, and the security is not yet overbought or oversold, it may indicate a potential buying or selling opportunity.
Confirm the validity of breakouts: If the AD Line is moving in the same direction as a breakout in the price of the security, it can confirm the validity of the breakout.
Bollinger Bands
Definition
Bollinger Bands are a technical analysis tool that consists of two standard deviation bands plotted above and below a simple moving average. The upper band is typically set two (2) standard deviations above the moving average, while the lower band is set two (2) standard deviations below the moving average. The bands are designed to provide a visual representation of the volatility and price range of a security.
Usage
Bollinger Bands are used to identify potential overbought or oversold conditions in a security. When a security's price is near the upper band, it may be considered overbought, indicating that the security may be due for a price correction. Conversely, when a security's price is near the lower band, it may be considered oversold, indicating that the security may be due for a price rebound.
Bollinger Bands can also be used to identify potential trend reversals. When a security's price is consistently touching or crossing one of the bands, it may indicate a potential change in trend.
Interpretation
The interpretation of Bollinger Bands depends on the individual security being analyzed and the time frame being considered. Generally, wider bands indicate higher volatility, while narrower bands indicate lower volatility.
When a security's price is trading within the bands, it may be considered to be in a normal trading range. However, if the price moves outside of the bands, it may be an indication of a trend reversal or a change in market conditions.
Chaikin Oscillator
Definition
A Chaikin Oscillator chart is a technical analysis tool that measures the accumulation or distribution of a security based on its volume and price. It is used to identify potential trends and trend reversals, as well as potential buy or sell signals.
The Chaikin Oscillator is calculated by subtracting a 10-period exponential moving average of the Accumulation/Distribution Line from a 3-period exponential moving average of the Accumulation/Distribution Line.
Usage
Chaikin Oscillator is used to identify potential trends and trend reversals in a security's price. Traders and investors may use Chaikin Oscillator to identify potential buy or sell signals when the Chaikin Oscillator crosses certain thresholds or diverges from the price line.
To use Chaikin Oscillator, investors and analysts can plot them on a chart along with the security's price line and monitor how the Chaikin Oscillator interacts with the price line over time.
Interpretation
The interpretation of Chaikin Oscillator depends on the individual security being analyzed and the time frame being considered. When the Chaikin Oscillator is moving up, it indicates that there is more buying pressure in the security than selling pressure, which may be indicative of bullish sentiment. Conversely, when the Chaikin Oscillator is moving down, it indicates that there is more selling pressure in the security than buying pressure, which may be indicative of bearish sentiment.
The Chaikin Oscillator can also be used to identify potential support and resistance levels. When the price line of a security crosses above or below the Chaikin Oscillator, it may indicate a potential change in the direction of the trend.
Chaikin Money Flow
Definition
A Chaikin Money Flow (CMF) chart is a technical analysis tool that measures the accumulation or distribution of a security based on its volume and price. It is used to identify potential trends and trend reversals, as well as potential buy or sell signals.
The CMF indicator is calculated by taking the sum of the money flow volume over a specified time period and dividing it by the sum of the volume over the same period. The result is then plotted on a chart to create the CMF line.
Usage
CMF charts are used to identify potential trends and trend reversals in a security's price. When the CMF line is moving up, it may indicate an uptrend, while a downward slope may indicate a downtrend. Traders and investors may use CMF charts to identify potential buy or sell signals when the CMF line crosses certain thresholds or diverges from the price line.
Interpretation
The interpretation of CMF charts depends on the individual security being analyzed and the time frame being considered. When the CMF line is moving up, it indicates that more money is flowing into the security than out of it, which may be indicative of bullish sentiment. Conversely, when the CMF line is moving down, it indicates that more money is flowing out of the security than into it, which may be indicative of bearish sentiment.
CMF charts can also be used to identify potential support and resistance levels. When the price line of a security crosses above or below the CMF line, it may indicate a potential change in the direction of the trend.
Difference
Definition
A Difference chart is a technical analysis tool that measures the difference between two securities, typically of the same asset class, to identify potential trends and trading opportunities. The difference is calculated by subtracting the price of one security from the price of another security.
The difference can be displayed as a line chart or a bar chart, and it is commonly used in trading strategies such as spread trading or pair trading, which involves buying and selling two securities that have a historically correlated price movement.
Usage
Difference charts are used to identify potential trends and trading opportunities based on the difference between two securities. Traders and investors may use Difference charts to identify potential buy or sell signals when the difference crosses certain thresholds or diverges from a historical average.
To use Difference charts, investors and analysts can plot them on a chart and monitor how the difference interacts with other technical analysis tools or fundamental analysis factors.
Interpretation
The interpretation of Difference charts depends on the individual securities being analyzed and the time frame being considered. When the difference is increasing, it may indicate that one security is becoming relatively more expensive compared to the other, which may be indicative of a potential selling opportunity for the more expensive security or a buying opportunity for the cheaper security.
Difference charts can also be used to identify potential support and resistance levels, as well as potential divergences from historical trends or correlations. Traders and investors may also use Difference charts to identify potential trading opportunities based on historical price movements of the two securities being analyzed.
Directional Movement Index
Definition
A Directional Movement Index (DMI) chart is a technical analysis tool that measures the strength of a security's trend and identifies potential trend reversals. It is composed of three lines: the Positive Directional Indicator (+DI), the Negative Directional Indicator (-DI), and the Average Directional Index (ADX).
The +DI line measures the strength of the upward trend, the -DI line measures the strength of the downward trend, and the ADX line measures the overall strength of the trend.
Usage
DMI charts are used to identify potential trends and trend reversals in a security's price. When the +DI line is above the -DI line, it may indicate an uptrend, while a downward slope may indicate a downtrend. Traders and investors may use DMI charts to identify potential buy or sell signals when the +DI line crosses the -DI line or when the ADX line crosses certain thresholds.
Interpretation
The interpretation of DMI charts depends on the individual security being analyzed and the time frame being considered. When the +DI line is above the -DI line, it indicates that the upward trend is stronger than the downward trend, which may be indicative of bullish sentiment. Conversely, when the -DI line is above the +DI line, it indicates that the downward trend is stronger than the upward trend, which may be indicative of bearish sentiment.
The ADX line measures the overall strength of the trend. When the ADX line is moving up, it indicates that the trend is strong, while a downward slope may indicate that the trend is weakening or that the security is moving sideways.
Exponential Moving Average (EMA)
Definition
An Exponential Moving Average (EMA) chart is a technical analysis tool that is used to analyze price trends of a security. It is similar to a simple moving average (SMA) chart, but gives more weight to recent prices.
EMA charts calculate the average of a security's prices over a specified time period, with more recent prices given greater weight in the calculation. This creates a smoother line on the chart, with less lag compared to the SMA chart.
Usage
EMA charts are used to identify potential trends and trend reversals in a security's price. When the EMA line is moving up, it may indicate an uptrend, while a downward slope may indicate a downtrend. Traders and investors may use EMA charts to identify potential buy or sell signals when the EMA line crosses the security's price line.
The time period used to calculate the EMA can vary depending on the user's preferences and trading strategy. Common time periods used include 20, 50, and 200 days.
Interpretation
The interpretation of EMA charts depends on the individual security being analyzed and the time frame being considered. A rising EMA line may indicate bullish sentiment, while a falling EMA line may indicate bearish sentiment.
EMA charts can also be used to identify potential support and resistance levels. When the price line of a security crosses above or below the EMA line, it may indicate a potential change in the direction of the trend.
Linear Regression
Definition
A Linear Regression chart is a technical analysis tool that is used to analyze the trend of a security's prices over time. It is a statistical technique that calculates a line of best fit that represents the relationship between the security's price and time.
Linear Regression charts are often used to identify potential support and resistance levels in a security's price. The line of best fit is calculated by minimizing the sum of the squares of the vertical distances between the line and the actual prices. The line can then be used to project potential future price levels based on the current trend.
Usage
Linear Regression charts are used to identify potential trends and trend reversals in a security's price. The slope of the line can indicate the direction of the trend, while the position of the line relative to the price line can indicate potential support and resistance levels.
Traders and investors may use Linear Regression charts to identify potential buy or sell signals when the price line crosses the regression line. They can also be used to identify potential price targets based on the current trend.
Interpretation
The interpretation of Linear Regression charts depends on the individual security being analyzed and the time frame being considered. A rising regression line may indicate bullish sentiment, while a falling regression line may indicate bearish sentiment.
Linear Regression charts can also be used to identify potential support and resistance levels. When the price line of a security crosses above or below the regression line, it may indicate a potential change in the direction of the trend.
MACD
Definition
A Moving Average Convergence Divergence (MACD) chart is a technical analysis tool that measures the relationship between two exponential moving averages (EMAs) of a security's price. It is used to identify potential trends and trend reversals, as well as potential buy or sell signals.
The MACD line is the difference between a 26-period EMA and a 12-period EMA, while the signal line is a 9-period EMA of the MACD line. The histogram represents the difference between the MACD line and the signal line.
Usage
MACD charts are used to identify potential trends and trend reversals in a security's price. When the MACD line crosses above the signal line, it may indicate a bullish trend, while a crossover below the signal line may indicate a bearish trend. Traders and investors may use MACD charts to identify potential buy or sell signals when the MACD line and the signal line cross over or when the histogram diverges from the price line.
Interpretation
The interpretation of MACD charts depends on the individual security being analyzed and the time frame being considered. When the MACD line is above the signal line, it indicates that the short-term trend is stronger than the long-term trend, which may be indicative of bullish sentiment. Conversely, when the MACD line is below the signal line, it indicates that the long-term trend is stronger than the short-term trend, which may be indicative of bearish sentiment.
The histogram represents the difference between the MACD line and the signal line, and can be used to identify potential trend reversals. When the histogram diverges from the price line, it may indicate a potential change in the direction of the trend.
MaxDraw
Definition
A Maximum Drawdown (MaxDraw) chart is a technical analysis tool that measures the largest percentage drop in a security's value from its previous high to its lowest point. It is used to identify potential risks and losses in an investment, as well as to compare the performance of different investments.
The MaxDraw line is plotted on a chart using the percentage change in value from the security's previous high to its lowest point.
Usage
MaxDraw charts are used to assess the potential risks and losses associated with an investment. Investors and analysts may use MaxDraw charts to compare the performance of different securities or to evaluate the historical performance of a single security.
Interpretation
The interpretation of MaxDraw charts depends on the individual security being analyzed and the time frame being considered. When the MaxDraw line is moving up, it indicates that the security has experienced a larger percentage drop from its previous high to its lowest point, which may be indicative of higher risk and potential losses.
Conversely, when the MaxDraw line is moving down, it indicates that the security has experienced a smaller percentage drop from its previous high to its lowest point, which may be indicative of lower risk and potential losses.
MaxDraw charts can also be used to compare the performance of different securities. A security with a lower MaxDraw may be considered less risky and potentially more attractive to investors.
Money Flow Index
Definition
A Money Flow Index (MFI) chart is a technical analysis tool that measures the strength of buying and selling pressure in a security based on its price and volume. It is used to identify potential trends and trend reversals, as well as potential buy or sell signals.
The MFI indicator is calculated by taking the ratio of the money flow volume that is positive over a specified time period to the money flow volume that is negative over the same period. The result is then plotted on a chart to create the MFI line.
Usage
MFI charts are used to identify potential trends and trend reversals in a security's price. When the MFI line is moving up, it may indicate a potential uptrend, while a downward slope may indicate a potential downtrend. Traders and investors may use MFI charts to identify potential buy or sell signals when the MFI line crosses certain thresholds or diverges from the price line.
Interpretation
The interpretation of MFI charts depends on the individual security being analyzed and the time frame being considered. When the MFI line is moving up, it indicates that the buying pressure is increasing, which may be indicative of bullish sentiment. Conversely, when the MFI line is moving down, it indicates that the selling pressure is increasing, which may be indicative of bearish sentiment.
MFI charts can also be used to identify potential support and resistance levels. When the price line of a security crosses above or below the MFI line, it may indicate a potential change in the direction of the trend.
On Balance Volume
Definition
An On Balance Volume (OBV) chart is a technical analysis tool that measures the cumulative buying and selling pressure in a security based on its volume. It is used to identify potential trends and trend reversals, as well as potential buy or sell signals.
The OBV line is calculated by adding the volume of a security on days when the price increases and subtracting the volume on days when the price decreases. The result is then plotted on a chart to create the OBV line.
Usage
OBV charts are used to identify potential trends and trend reversals in a security's price. When the OBV line is moving up, it may indicate a potential uptrend, while a downward slope may indicate a potential downtrend. Traders and investors may use OBV charts to identify potential buy or sell signals when the OBV line crosses certain thresholds or diverges from the price line.
To use OBV charts, investors and analysts can plot them on a chart along with the security's price line and monitor how the OBV line interacts with the price line over time.
Interpretation
The interpretation of OBV charts depends on the individual security being analyzed and the time frame being considered. When the OBV line is moving up, it indicates that the buying pressure is increasing, which may be indicative of bullish sentiment. Conversely, when the OBV line is moving down, it indicates that the selling pressure is increasing, which may be indicative of bearish sentiment.
OBV charts can also be used to identify potential support and resistance levels. When the price line of a security crosses above or below the OBV line, it may indicate a potential change in the direction of the trend.
Price Channel
Definition
A Price Channel chart is a technical analysis tool that is used to analyze the trend of a security's prices over time. It consists of two parallel lines that are plotted above and below the security's price line, representing the upper and lower boundaries of the price channel.
The upper boundary of the price channel is typically created by connecting the highest prices of the security over a specified time period, while the lower boundary is created by connecting the lowest prices of the security over the same time period.
Price Channel charts are often used to identify potential support and resistance levels in a security's price. The upper and lower boundaries of the channel can be used to identify potential buy and sell signals when the price line crosses either boundary.
Usage
Price Channel charts are used to identify potential trends and trend reversals in a security's price. When the price line of a security is consistently moving between the upper and lower boundaries of the channel, it may indicate a potential continuation of the trend. Conversely, when the price line breaks above or below one of the boundaries, it may indicate a potential change in the direction of the trend.
Traders and investors may use Price Channel charts to identify potential buy or sell signals when the price line crosses either boundary. They can also be used to identify potential price targets based on the current trend.
Interpretation
The interpretation of Price Channel charts depends on the individual security being analyzed and the time frame being considered. A rising channel may indicate bullish sentiment, while a falling channel may indicate bearish sentiment.
Price Channel charts can also be used to identify potential support and resistance levels. When the price line of a security crosses above or below the upper or lower boundary of the channel, it may indicate a potential change in the direction of the trend.
Price Envelopes
Definition
A Price Envelopes chart is a technical analysis tool that is used to analyze the trend of a security's prices over time. It consists of two parallel lines that are plotted above and below the security's price line, representing the upper and lower boundaries of the price envelope.
The upper and lower boundaries of the price envelope are typically created by adding and subtracting a percentage from the security's moving average price over a specified time period. The percentage used to create the envelope can vary depending on the user's preferences and trading strategy.
Price Envelopes charts are often used to identify potential support and resistance levels in a security's price. The upper and lower boundaries of the envelope can be used to identify potential buy and sell signals when the price line crosses either boundary.
Usage
Price Envelopes charts are used to identify potential trends and trend reversals in a security's price. When the price line of a security is consistently moving between the upper and lower boundaries of the envelope, it may indicate a potential continuation of the trend. Conversely, when the price line breaks above or below one of the boundaries, it may indicate a potential change in the direction of the trend.
Traders and investors may use Price Envelopes charts to identify potential buy or sell signals when the price line crosses either boundary. They can also be used to identify potential price targets based on the current trend.
Interpretation
The interpretation of Price Envelopes charts depends on the individual security being analyzed and the time frame being considered. A rising envelope may indicate bullish sentiment, while a falling envelope may indicate bearish sentiment.
Price Envelopes charts can also be used to identify potential support and resistance levels. When the price line of a security crosses above or below the upper or lower boundary of the envelope, it may indicate a potential change in the direction of the trend.
RSI
Definition
A Relative Strength Index (RSI) chart is a technical analysis tool that measures the strength and momentum of a security's price movements. It is used to identify potential trends and trend reversals, as well as potential buy or sell signals.
The RSI indicator is calculated using the average gain of a security's price over a specified time period divided by the average loss over the same period. The result is then plotted on a chart to create the RSI line, which typically oscillates between 0 and 100.
Usage
RSI charts are used to identify potential trends and trend reversals in a security's price. When the RSI line is moving up, it may indicate a potential uptrend, while a downward slope may indicate a potential downtrend. Traders and investors may use RSI charts to identify potential buy or sell signals when the RSI line crosses certain thresholds, such as 30 or 70, or when it diverges from the price line.
Interpretation
The interpretation of RSI charts depends on the individual security being analyzed and the time frame being considered. When the RSI line is below 30, it indicates that the security may be oversold and potentially undervalued, which may be indicative of a potential buying opportunity. Conversely, when the RSI line is above 70, it indicates that the security may be overbought and potentially overvalued, which may be indicative of a potential selling opportunity.
RSI charts can also be used to identify potential support and resistance levels. When the price line of a security crosses above or below the RSI line, it may indicate a potential change in the direction of the trend.
SMA
Definition
A Simple Moving Average (SMA) chart is a technical analysis tool that is used to analyze the trend of a security's prices over time. It is calculated by taking the average price of a security over a specified time period and plotting it on a chart. The SMA line is then smoothed by taking the average of a set number of periods.
SMA charts are often used to identify potential support and resistance levels in a security's price. The SMA line can be used to identify potential buy and sell signals when the price line crosses above or below it.
Usage
SMA charts are used to identify potential trends and trend reversals in a security's price. When the SMA line is moving up, it may indicate an uptrend, while a downward slope may indicate a downtrend. Traders and investors may use SMA charts to identify potential buy or sell signals when the price line crosses the SMA line.
The time period used to calculate the SMA can vary depending on the user's preferences and trading strategy. Common time periods used include 20, 50, and 200 days.
Interpretation
The interpretation of SMA charts depends on the individual security being analyzed and the time frame being considered. A rising SMA line may indicate bullish sentiment, while a falling SMA line may indicate bearish sentiment.
SMA charts can also be used to identify potential support and resistance levels. When the price line of a security crosses above or below the SMA line, it may indicate a potential change in the direction of the trend.
Spread
Definition
A Spread chart is a technical analysis tool that measures the difference between two securities, typically of the same asset class, to identify potential trends and trading opportunities. The spread is calculated by subtracting the price of one security from the price of another security.
The spread can be displayed as a line chart or a bar chart, and it is commonly used in trading strategies such as pairs trading, which involves buying and selling two securities that have a historically correlated price movement.
Usage
Spread charts are used to identify potential trends and trading opportunities based on the difference between two securities. Traders and investors may use Spread charts to identify potential buy or sell signals when the spread crosses certain thresholds or diverges from a historical average.
To use Spread charts, investors and analysts can plot them on a chart and monitor how the spread interacts with other technical analysis tools or fundamental analysis factors.
Interpretation
The interpretation of Spread charts depends on the individual securities being analyzed and the time frame being considered. When the spread is widening, it may indicate that one security is becoming relatively more expensive compared to the other, which may be indicative of a potential selling opportunity for the more expensive security or a buying opportunity for the cheaper security.
Spread charts can also be used to identify potential support and resistance levels, as well as potential divergences from historical trends or correlations. Traders and investors may also use Spread charts to identify potential trading opportunities based on historical price movements of the two securities being analyzed.
Stochastic
Definition
A Stochastic chart is a technical analysis tool that measures the strength and momentum of a security's price movements. It is used to identify potential trends and trend reversals, as well as potential buy or sell signals.
The Stochastic indicator is calculated using the highest high and lowest low of a security's price over a specified time period and comparing the current price to this range. The result is then plotted on a chart to create the Stochastic line, which typically oscillates between 0 and 100.
Usage
Stochastic charts are used to identify potential trends and trend reversals in a security's price. When the Stochastic line is moving up, it may indicate a potential uptrend, while a downward slope may indicate a potential downtrend. Traders and investors may use Stochastic charts to identify potential buy or sell signals when the Stochastic line crosses certain thresholds, such as 20 or 80, or when it diverges from the price line.
To use Stochastic charts, investors and analysts can plot them on a chart along with the security's price line and monitor how the Stochastic line interacts with the price line over time.
Interpretation
The interpretation of Stochastic charts depends on the individual security being analyzed and the time frame being considered. When the Stochastic line is below 20, it indicates that the security may be oversold and potentially undervalued, which may be indicative of a potential buying opportunity. Conversely, when the Stochastic line is above 80, it indicates that the security may be overbought and potentially overvalued, which may be indicative of a potential selling opportunity.
Stochastic charts can also be used to identify potential support and resistance levels. When the price line of a security crosses above or below the Stochastic line, it may indicate a potential change in the direction of the trend.
Weighted Moving Average
Definition
A Weighted Moving Average (WMA) chart is a technical analysis tool that is used to analyze the trend of a security's prices over time. It is similar to a simple moving average (SMA) chart, but gives more weight to recent prices.
WMA charts calculate the average of a security's prices over a specified time period, but unlike the SMA chart, the WMA gives more weight to the most recent prices. This results in a smoother line on the chart that more closely follows the recent price movements.
Usage
WMA charts are used to identify potential trends and trend reversals in a security's price. When the WMA line is moving up, it may indicate an uptrend, while a downward slope may indicate a downtrend. Traders and investors may use WMA charts to identify potential buy or sell signals when the price line crosses the WMA line.
The time period used to calculate the WMA can vary depending on the user's preferences and trading strategy. Common time periods used include 20, 50, and 200 days.
Interpretation
The interpretation of WMA charts depends on the individual security being analyzed and the time frame being considered. A rising WMA line may indicate bullish sentiment, while a falling WMA line may indicate bearish sentiment.
WMA charts can also be used to identify potential support and resistance levels. When the price line of a security crosses above or below the WMA line, it may indicate a potential change in the direction of the trend.
Volume
Definition
A Volume chart is a technical analysis tool that is used to analyze the trading volume of a security over time. It represents the total number of shares or contracts that have been traded during a specified time period.
Volume charts are often used to identify potential support and resistance levels in a security's price. Higher trading volume can indicate stronger buying or selling pressure, which may influence the price direction of the security.
Usage
Volume charts are used to identify potential trends and trend reversals in a security's price. When the volume is increasing or decreasing over time, it may indicate a potential change in the direction of the trend. Traders and investors may use volume charts to identify potential buy or sell signals when the volume line crosses certain thresholds or diverges from the price line.
Interpretation
The interpretation of Volume charts depends on the individual security being analyzed and the time frame being considered. Higher volume can indicate greater liquidity in the security, while lower volume may indicate less interest or activity.
Volume charts can also be used to identify potential support and resistance levels. When the volume is higher near a certain price level, it may indicate that there is greater demand or supply at that price.
Volume by Price
Definition
A Volume by Price chart is a technical analysis tool that is used to analyze the trading volume of a security at different price levels over time. It shows the total volume of shares or contracts traded at each price level, providing a visual representation of the market activity around a certain price.
Volume by Price charts are often used to identify potential support and resistance levels in a security's price. They can also help identify price levels where there is significant buying or selling pressure.
Usage
Volume by Price charts are used to identify potential trends and trend reversals in a security's price. When the volume is higher or lower at certain price levels, it may indicate a potential change in the direction of the trend. Traders and investors may use volume by price charts to identify potential buy or sell signals at certain price levels based on the volume.
Interpretation
The interpretation of Volume by Price charts depends on the individual security being analyzed and the time frame being considered. Higher volume at certain price levels may indicate stronger buying or selling pressure at those levels.
Volume by Price charts can also be used to identify potential support and resistance levels. When the volume is higher near a certain price level, it may indicate that there is greater demand or supply at that price.
Volume Weighted Avg Price
Definition
A Volume Weighted Average Price (VWAP) chart is a technical analysis tool that is used to analyze the average price of a security over a specified time period, weighted by the trading volume of each period. It provides an average price for the security that takes into account the volume of shares or contracts traded at each price level.
VWAP charts are often used by institutional traders to gauge whether they are getting a good price when executing large orders, as well as by traders and investors to identify potential support and resistance levels.
Usage
VWAP charts are used to identify potential trends and trend reversals in a security's price. When the price line is consistently above or below the VWAP line, it may indicate a potential continuation of the trend. Conversely, when the price line breaks above or below the VWAP line, it may indicate a potential change in the direction of the trend.
Traders and investors may use VWAP charts to identify potential buy or sell signals when the price line crosses the VWAP line. They can also be used to identify potential price targets based on the current trend.
Interpretation
The interpretation of VWAP charts depends on the individual security being analyzed and the time frame being considered. When the price line is consistently above the VWAP line, it may indicate that the security is overvalued. Conversely, when the price line is consistently below the VWAP line, it may indicate that the security is undervalued.
VWAP charts can also be used to identify potential support and resistance levels. When the price line of a security crosses above or below the VWAP line, it may indicate a potential change in the direction of the trend.