Technical Charts
Technical indicator charts are an essential tool for investors who want to analyze and understand the movements of financial markets. These charts are based on mathematical calculations that use historical price and volume data to identify trends, momentum, and potential trading opportunities.
Technical indicators can help investors to identify patterns and signals that may not be immediately apparent in the raw data, making it easier to make informed investment decisions.
Page Layout
The default page shows a total return chart spanning the entire width and height of the screen.
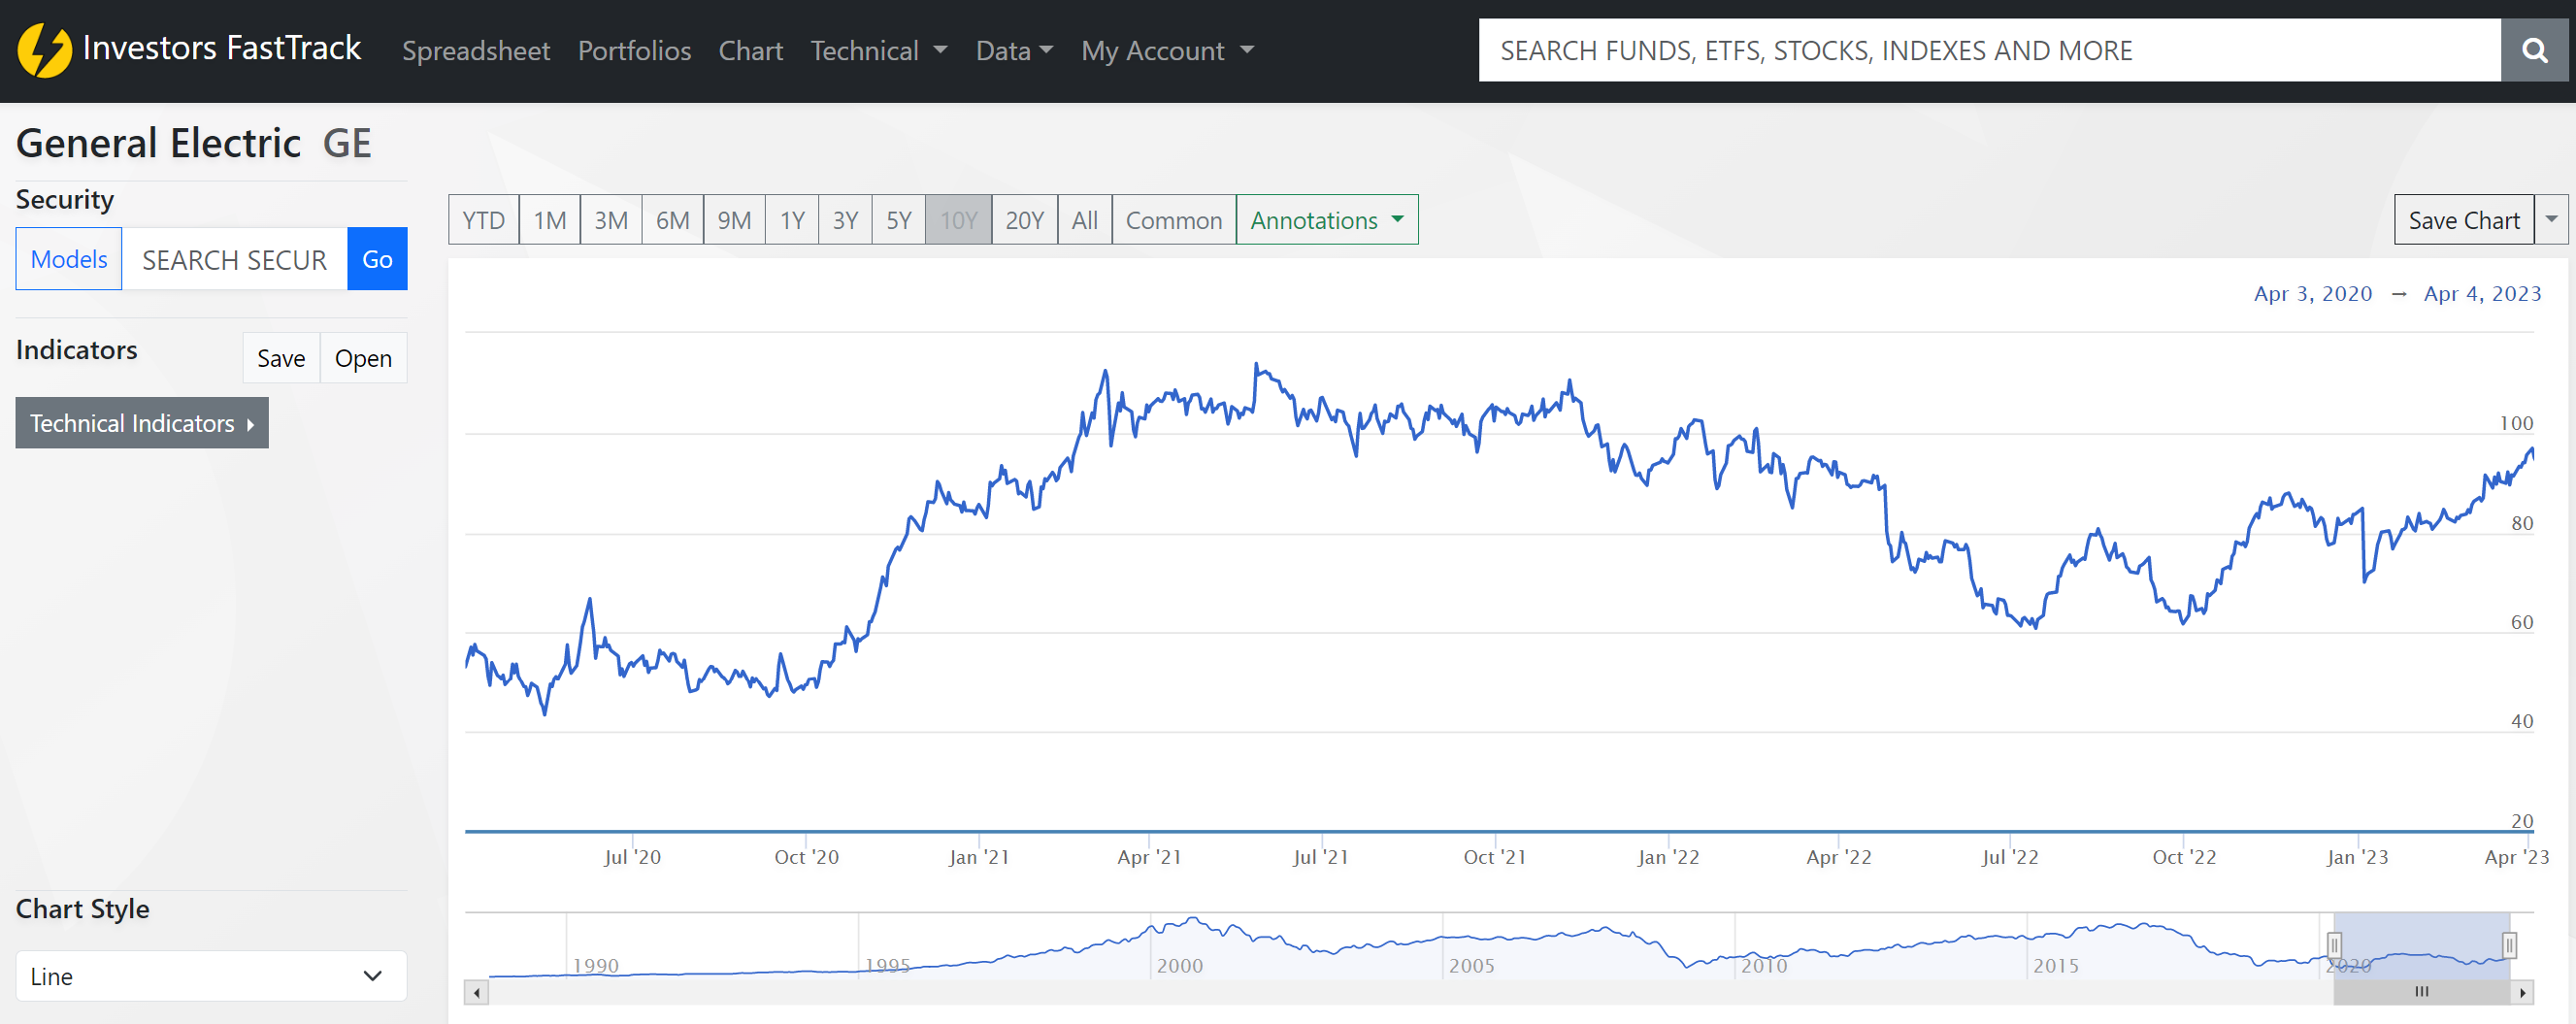
New securities
Load a new security by searching for a security in the left side security search.
Models Portfolios
Load a saved investment model by clicking the "models" button. Select the desired model and load on the technical chart.
Basic Charts
In the lower left of the screen, use the drop box to change the default chart into 4 types of charts.
- Line - a single line showing the adjusted closing prices of a security of portfolio
- OLHV - For exchange traded securities, such as ETFs or Stocks, select this option to transform the chart into an Open, Low, High, and volume chart.
- Candle - Also available only for exchange traded securities. Candle representation of open, high, low, and close data.
- Change of $10k - Similar to the line chart, but instead of displaying the adjusted closing price, all values are shown as a change of $10,000. The first day of the chart is $10k, and adjusted by the total return percent change on each day after.
Annotations
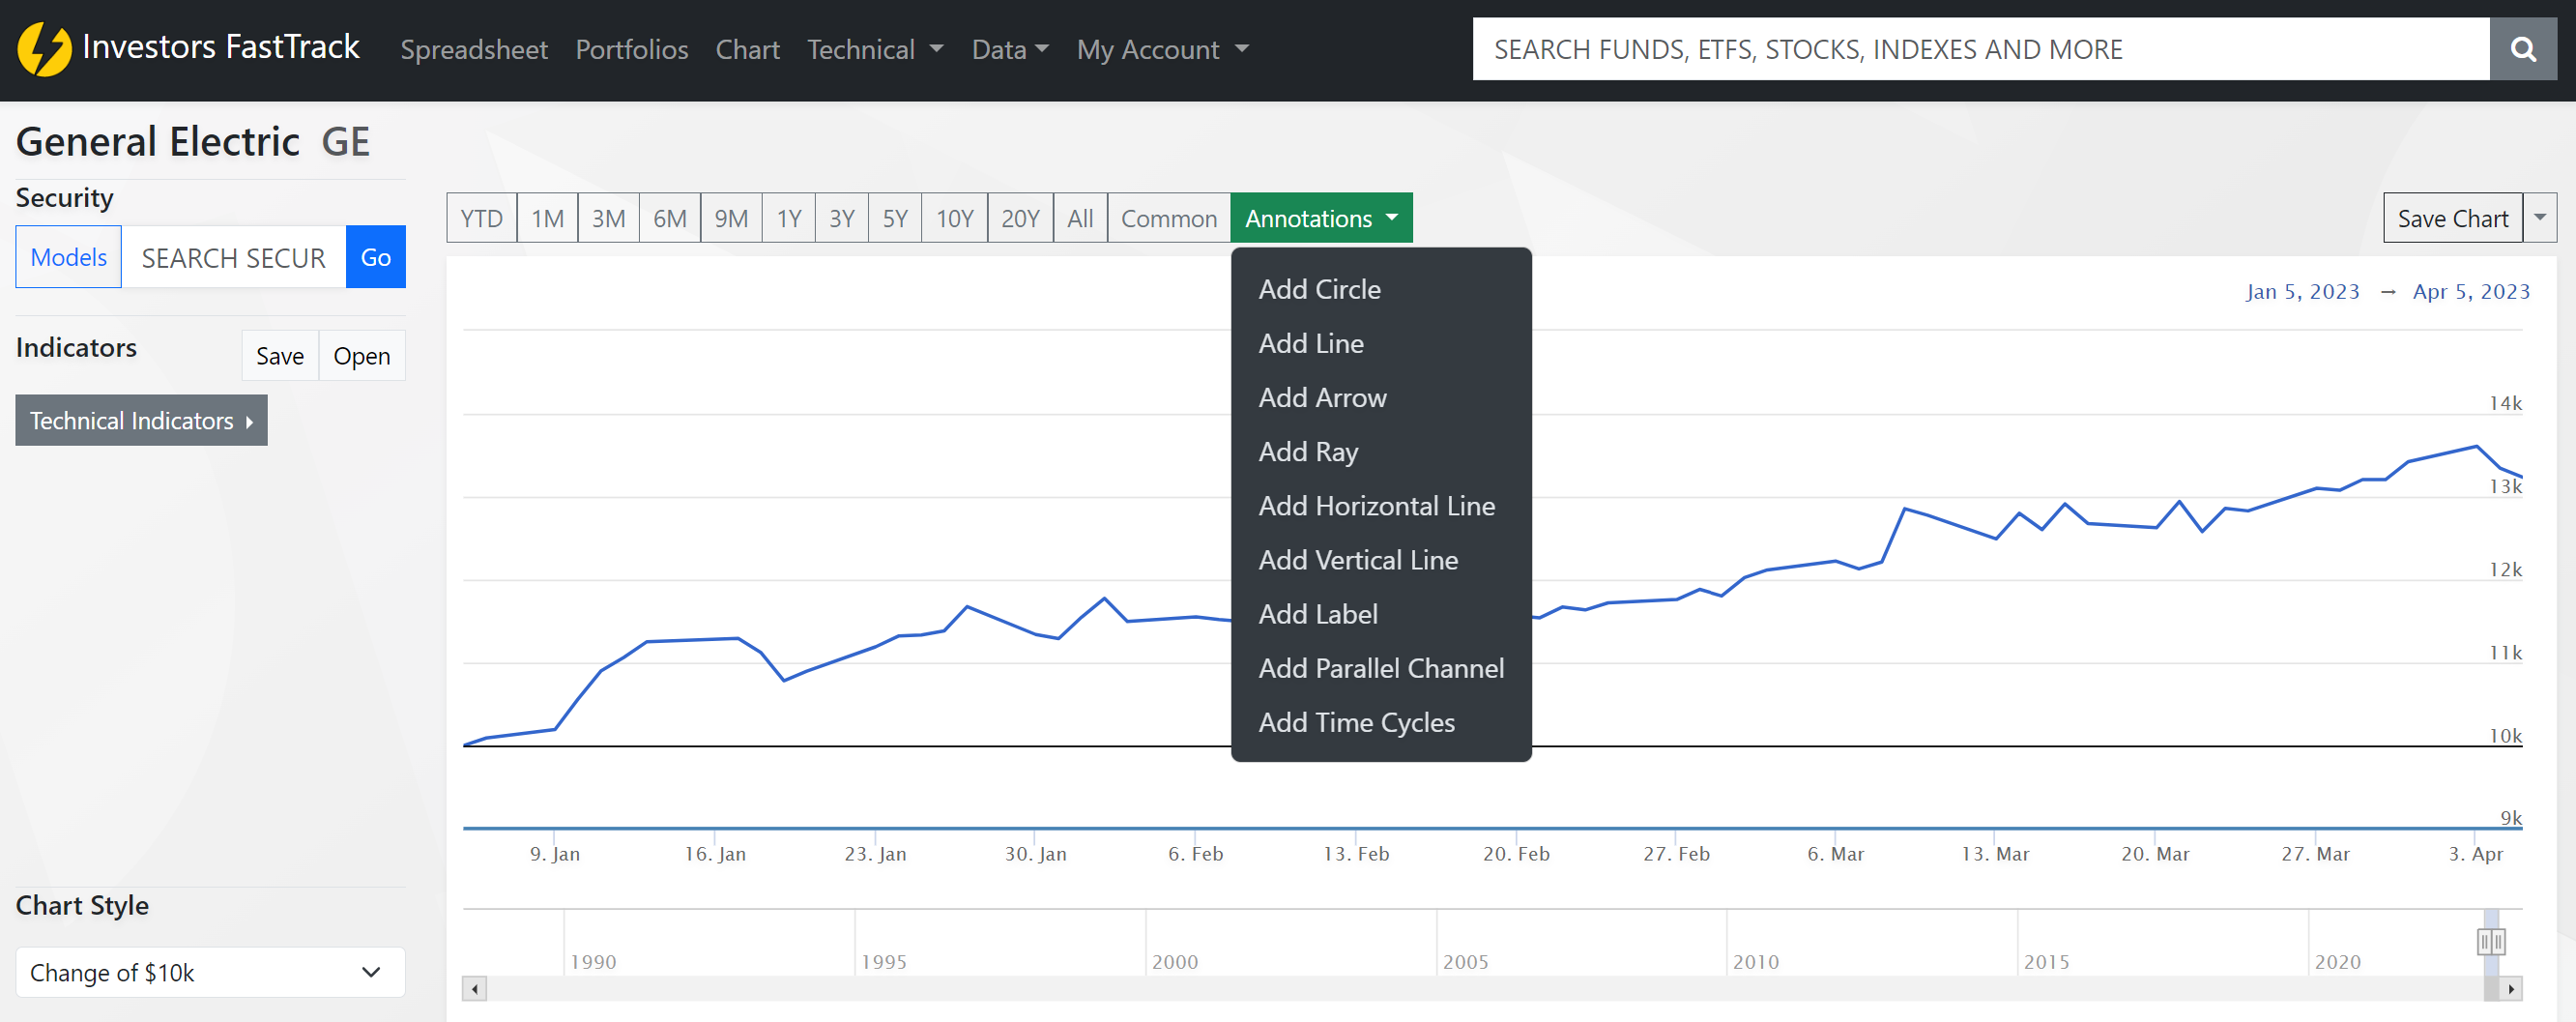
Chart annotations are visual elements that can be added to a chart to provide additional information or highlight specific data points. These annotations can take various forms, including lines, labels, shapes, and flags. Chart annotations can be customized in a variety of ways, including their position, size, color, and style.
Annotations persist only for the current chart. Refreshing the page, navigating to a new security or model will remove all annotations.
Arrow Annotations
They are graphical elements that consist of a line with an arrowhead pointing in a specific direction, and they can be placed at any point on the chart to highlight significant changes or movements in the data.
Arrow annotations can be used in various ways, such as indicating trend reversals, highlighting significant price movements or volumes, or marking key dates or events. For example, an upward-pointing arrow could be used to indicate a bullish trend or a buy signal, while a downward-pointing arrow could indicate a bearish trend or a sell signal.
Circle Annotations
Circle annotations are a type of chart annotation that is used to highlight specific data points or events on the chart. They are graphical elements that consist of a circle shape that is placed at a specific point on the chart, usually near a data point or event of interest.
Circle annotations can be used in various ways, such as indicating key support or resistance levels, marking important price or volume thresholds, or highlighting significant trends or movements in the data. They can also be used to draw attention to specific data points or events that are particularly noteworthy or require further analysis.
Horizontal line annotations
Used to indicate specific price levels, support and resistance levels, or other important thresholds within the data. They are graphical elements that consist of a straight line that extends horizontally across the chart, at a specific price level.
Horizontal line annotations can be used in various ways, such as indicating key support or resistance levels, marking important price thresholds, or highlighting significant trends or movements in the data. For example, a horizontal line annotation could be used to indicate a significant price level that has acted as support or resistance in the past, or a key moving average that is closely watched by investors.
Label Annotations
They are graphical elements that consist of a text label that is placed at a specific point on the chart, usually near a data point or event of interest.
Label annotations can be used in various ways, such as providing additional information about the data, marking important events or milestones, or highlighting significant trends or movements in the data. For example, a label annotation could be used to indicate the name of a company, the date of a major news event, or the value of a specific data point on the chart.
Line Annotations
Line annotations can be used in various ways, such as indicating support or resistance levels, highlighting significant price movements or trends, marking key dates or events, or separating different segments of data.
For example, in a stock price chart, a line annotation could be used to indicate the level of a key moving average, such as the 50-day or 200-day moving average. This can help investors to identify potential buying or selling opportunities based on whether the stock price is trading above or below this key level.
Parallel Channel
Used to identify and visualize a range of prices that a security is likely to trade within. They are graphical elements that consist of two parallel lines that are drawn above and below the stock price line on the chart.
Parallel channel annotations are useful for identifying key support and resistance levels and for determining the strength and direction of a trend. They can also help investors and analysts to identify potential trading opportunities, such as buying when the price reaches the lower channel line and selling when it reaches the upper channel line.
Ray Annotations
They are graphical elements that consist of a line that extends from a specific point on the chart to infinity in one direction, either to the right or left of the chart.
Ray annotations are particularly useful for identifying long-term trends and support and resistance levels that extend into the future. They can also be used to identify trend lines, which can help investors and analysts to better understand the direction and strength of a trend.
Time cycle annotations
Time cycle annotations are a type of chart annotation that is used to identify cyclical patterns in the price or movement of a security over time. They are graphical elements that can take various forms, such as lines or shapes, and are placed on the chart to indicate specific points in time where a pattern or cycle is likely to repeat.
Time cycle annotations are useful for identifying repeating patterns or cycles in the data, such as seasonal trends or patterns that occur at regular intervals. They can help investors and analysts to identify potential trading opportunities, such as buying or selling at key points within the cycle.
Vertical Line Annotations
They are graphical elements that consist of a straight line that extends vertically across the chart, at a specific date or time.
Vertical line annotations can be used in various ways, such as indicating key dates or events, marking important news releases or corporate announcements, or highlighting significant trends or movements in the data. For example, a vertical line annotation could be used to indicate the date of a major earnings report, a key economic indicator release, or a significant news event that affected the price of the stock.
Save Image
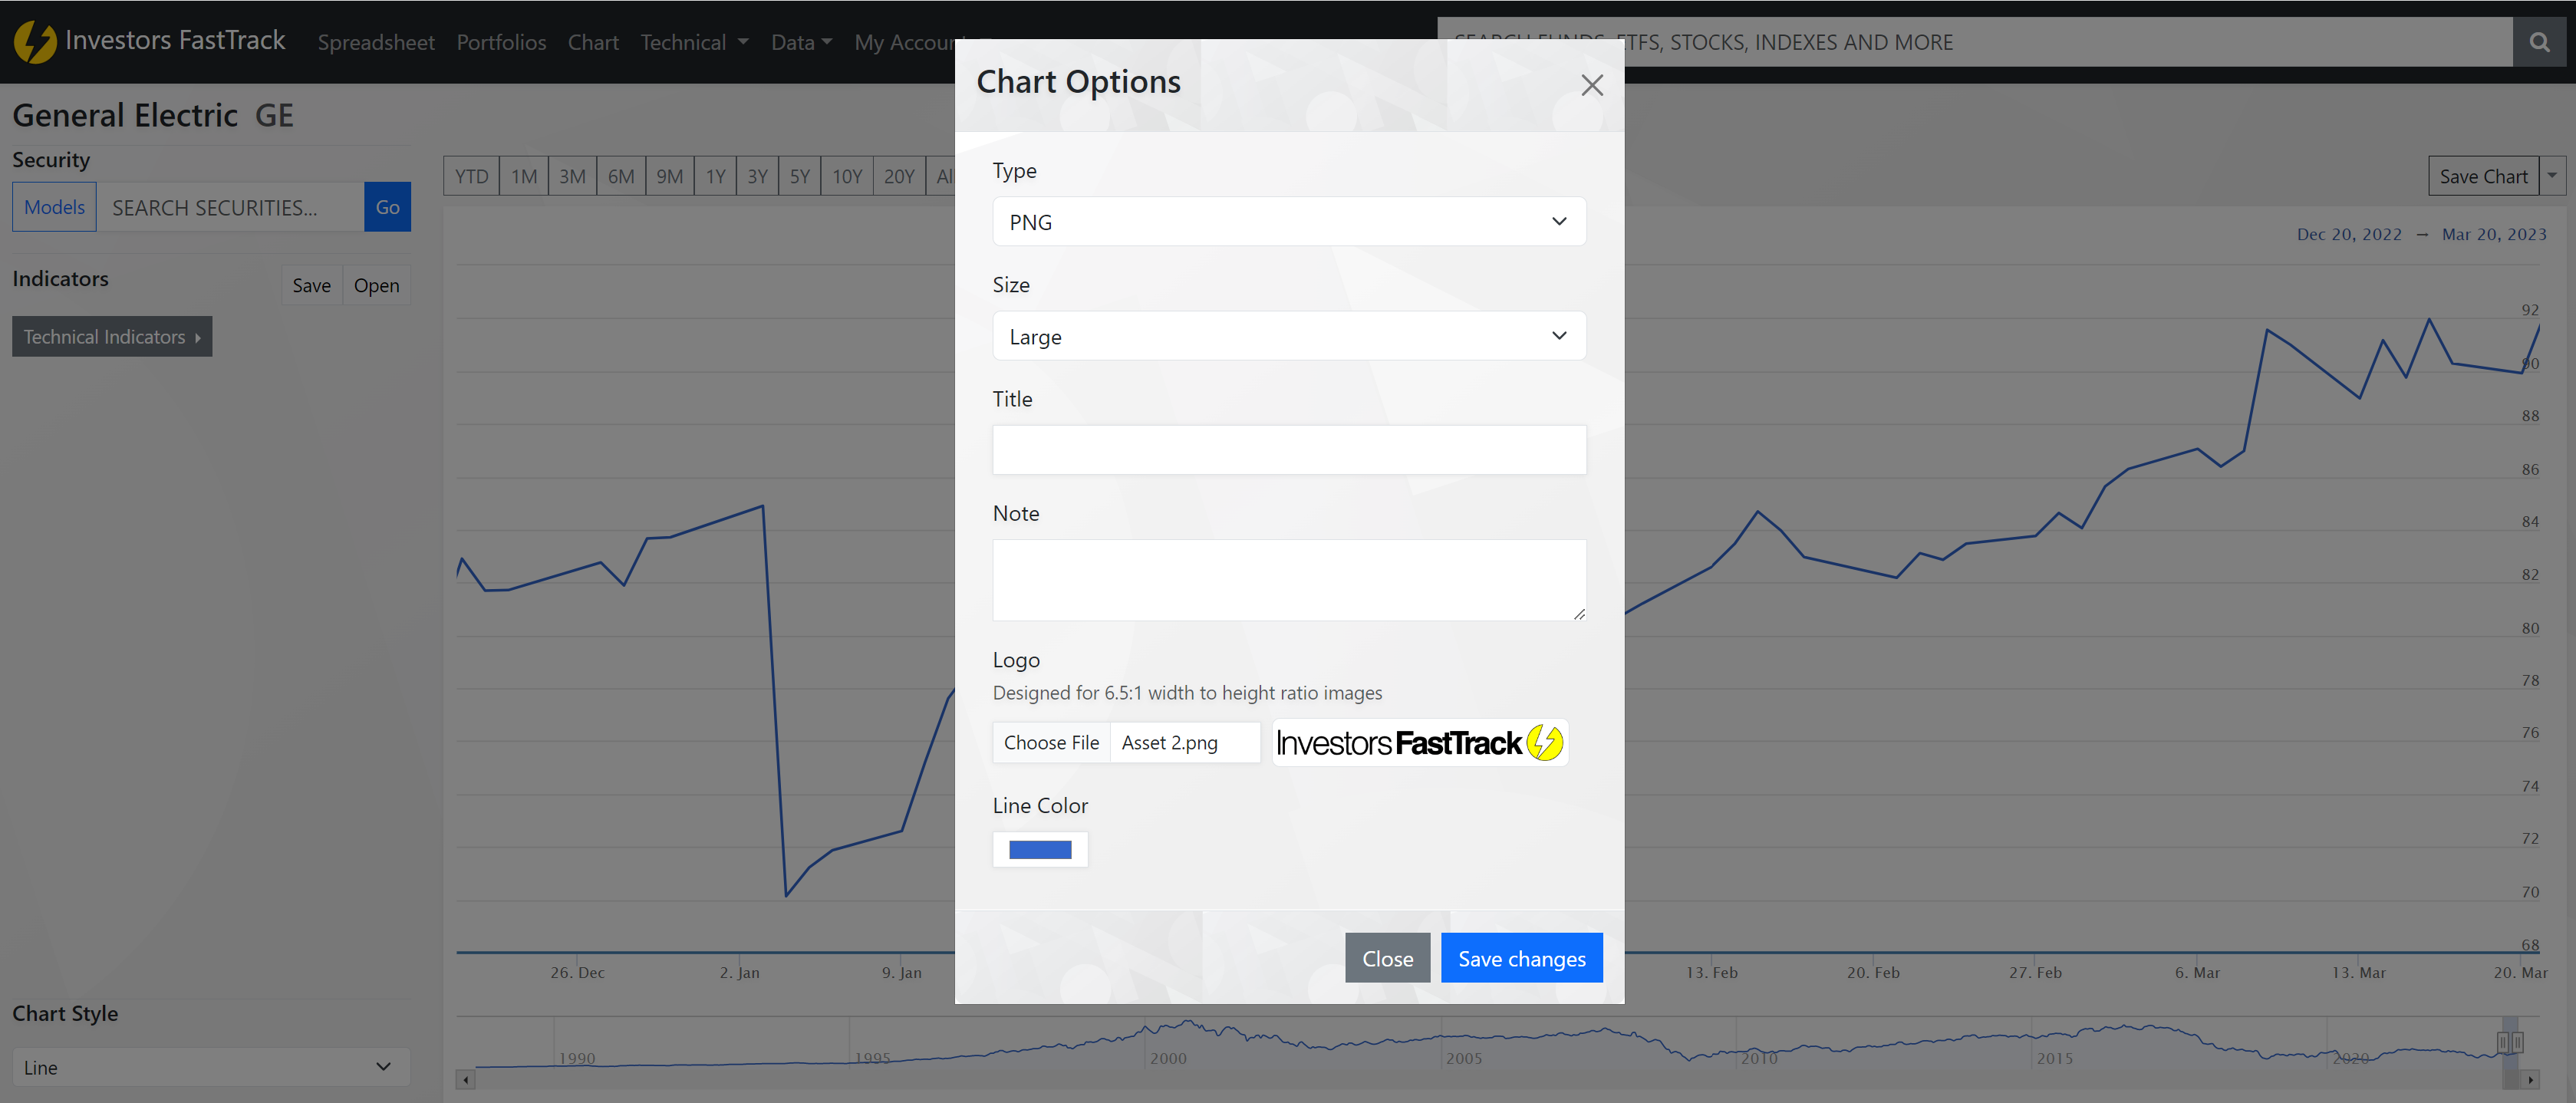
Click the save button at the upper right of the chart to open the save dialog box. Here you'll find the settings chart image save.
Type
Choose the type of image to save. Options: PNG, JPG, SVG, PDF
Size
Choose the size of the image you want to save.
Title
This is text to appear at the top center of the chart
Notes
This is small text that will appear at the bottom of the chart. Add disclaimers, commentary, or something similar if desired.
Logo
A company logo to add to the left side of the saved chart image. Optimal logo size is 6.5:1 width to height ratio images.