Overview
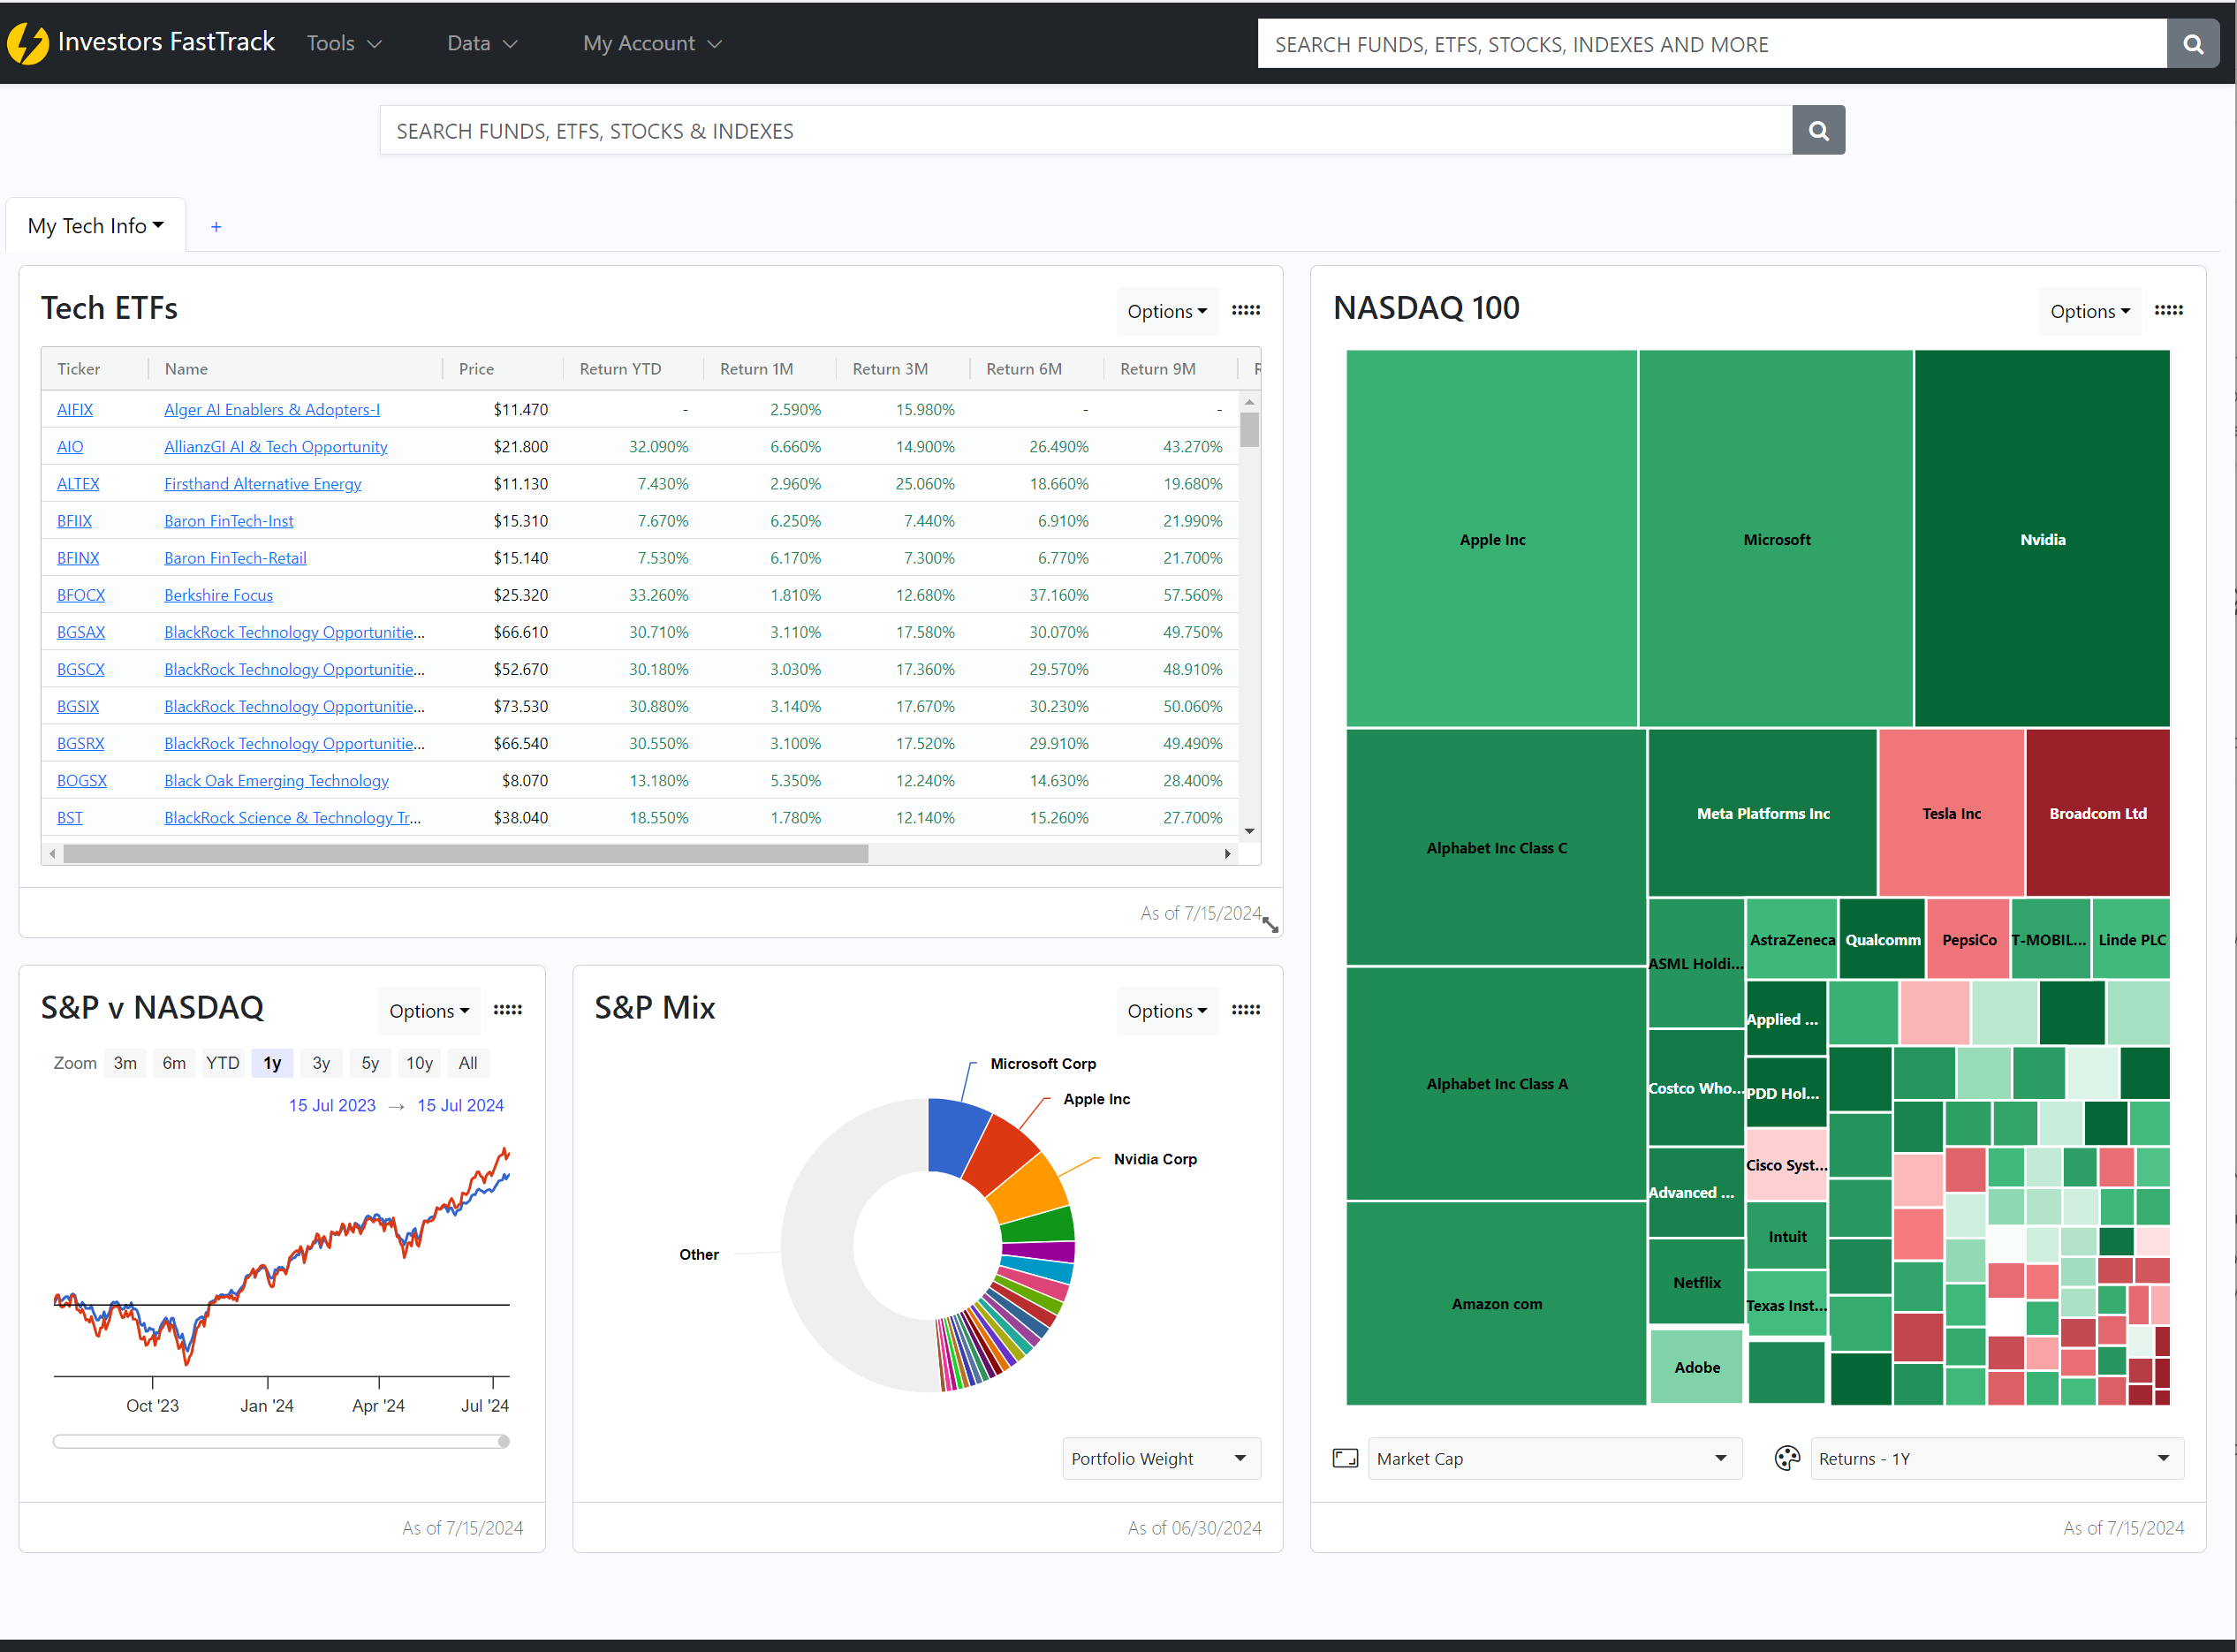
The Dashboard serves as your central hub for financial analysis, allowing you to create a personalized view of the market with various visualization tools. Customize your dashboard by adding multiple tabs and diverse tiles including spreadsheets, heatmaps, scatterplots, pie charts, and line charts. This flexibility ensures you can adapt the dashboard to fit the unique needs of your analysis, making it a powerful tool for your investment decisions.
Adding and Organizing Tabs
Create a New Tab
- Navigation: Locate the '+' icon next to the existing dashboard tabs at the top of the screen.
- Add Tab: Click on the '+' icon and enter a name for your new tab.
Switching Between Tabs
- Selection: Click on the tab name to switch between different views of your dashboard.
Customizing Tiles
Adding Tiles
- Access Tile Menu: Click on 'Create New Tile' from the dashboard.
- Select Tile Type: Choose from various types such as Chart, Scatter Plot, Spreadsheet, etc.
- Configure Tile: Each tile type has specific settings such as data sources and visual configuration that can be customized according to your needs.
Editing and Resizing Tiles
- Modify Tiles: Hover over the tile and click the 'Edit' button to change settings or drag the edges to resize.
Key Features
Visualization Tools
- Charts and Graphs: Integrate various charts and graphs like line charts, bar charts, and more.
- Interactive Elements: Interact with the data through sorting, filtering, and drilling down into specifics.
- Real-Time Data Updating: Configure tiles to display live data feeds, keeping you updated with the latest market movements.
Customization
- Drag and Drop Interface: Easily rearrange tiles to design your ideal layout.
- Personalized Settings: Save layouts, preferred data sources, and frequently used configurations for quick access.
Conclusion
Our dashboard is not just a tool; it's a canvas where you paint your market perspective. With extensive customization options, view the market as you wish to see it. Tailor the dashboard to highlight the data points most crucial to you, ensuring every decision is informed by data personalized to your strategies.
Enhance your investment strategies by visualizing and interpreting the market on your terms, using our advanced customization options to focus precisely on what matters most to you.