Heatmap: Visualize Your Path to Investment Success
Unlock the full potential of market analysis with our state-of-the-art Heatmap tool. Designed to transform complex data into intuitive, easy-to-understand visual insights, this tool is your gateway to identifying trends, opportunities, and risks at a glance.
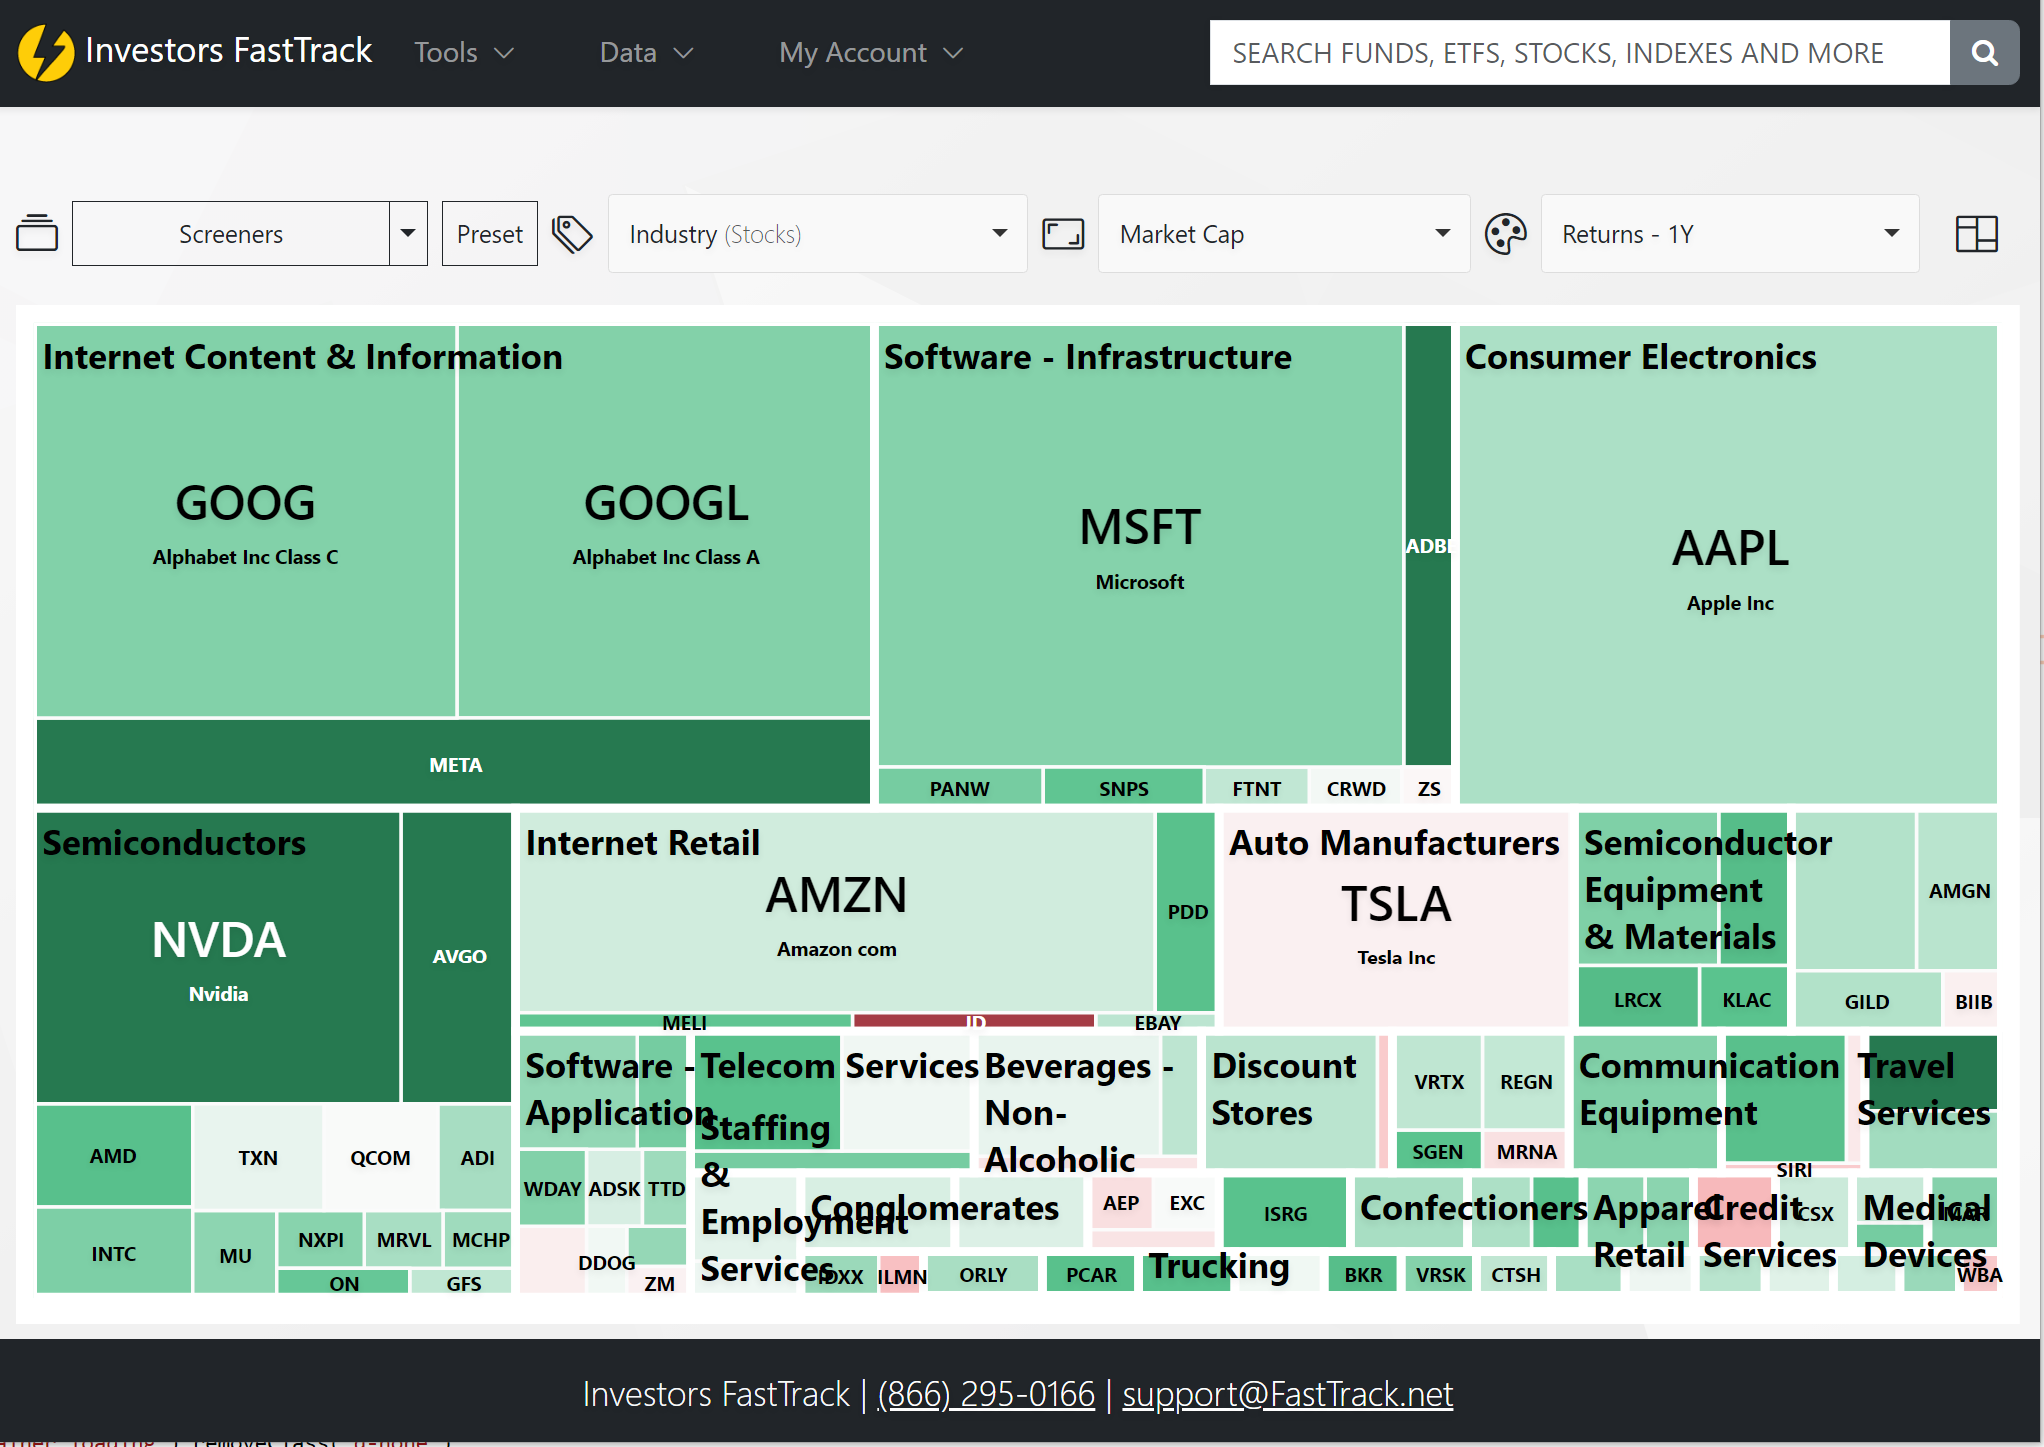
Elevate Your Market Insight
Our Heatmap tool revolutionizes the way you interact with financial data. By converting the performance metrics of various ticker symbols into a visually engaging grid, you gain an unparalleled perspective on the market dynamics.
Key Features That Set You Apart:
- Dynamic Tile Sizing: Each tile's dimensions are a direct reflection of its corresponding 'size by' metric, offering a proportional visual cue that effortlessly draws your attention to the most impactful data points.
- Color-Coded Insights: Dive into a spectrum of insights with tiles colored to represent their 'color by' metric. At a mere glance, distinguish between:
- 🟢 Green for positive performance indicators such as growth or returns, highlighting success stories.
- 🔴 Red for warnings of potential declines, guiding you away from pitfalls.
- Intuitive Grouping: Seamlessly categorize securities with the 'group by' feature, organizing your analysis for a structured and coherent overview
Navigate with Ease: Interface Highlights
1. Effortless Ticker Selection
Located at the forefront, two intuitive buttons empower you to tailor the heatmap to your specific interests:
Screener: A familiar, yet powerful, tool that filters and selects tickers based on your criteria, ensuring that only the most relevant data populates your heatmap.
Presets: Fast-track your analysis with pre-defined categories of tickers, from Stock Indexes to ETF Categories, offering a shortcut to targeted insights.
2. Customize Your Perspective
Mono Size: Choose a uniform tile size for a simplified, egalitarian view where every ticker stands on equal footing.
Size by Metric: Opt for a dynamic visualization where tile sizes vary according to specific metrics, highlighting the weight of each ticker's performance in your analysis.
Transform Analysis into Action
- Select Your Focus: Begin with the 'Screener' for a tailored approach or 'Presets' for efficiency.
- Visualize the Market: Choose how you want the data to be represented, ensuring the view aligns with your analysis goals.
- Decipher & Decide: Let the heatmap guide your eyes to patterns, outliers, and correlations, empowering you to make informed decisions with confidence.
Step into a world where data doesn't overwhelm but enlightens. Our Heatmap tool is more than just a feature; it's your strategic partner in navigating the complexities of the market. Visualize success, identify opportunities, and elevate your investment strategy with clarity and precision.