Timeseries Data
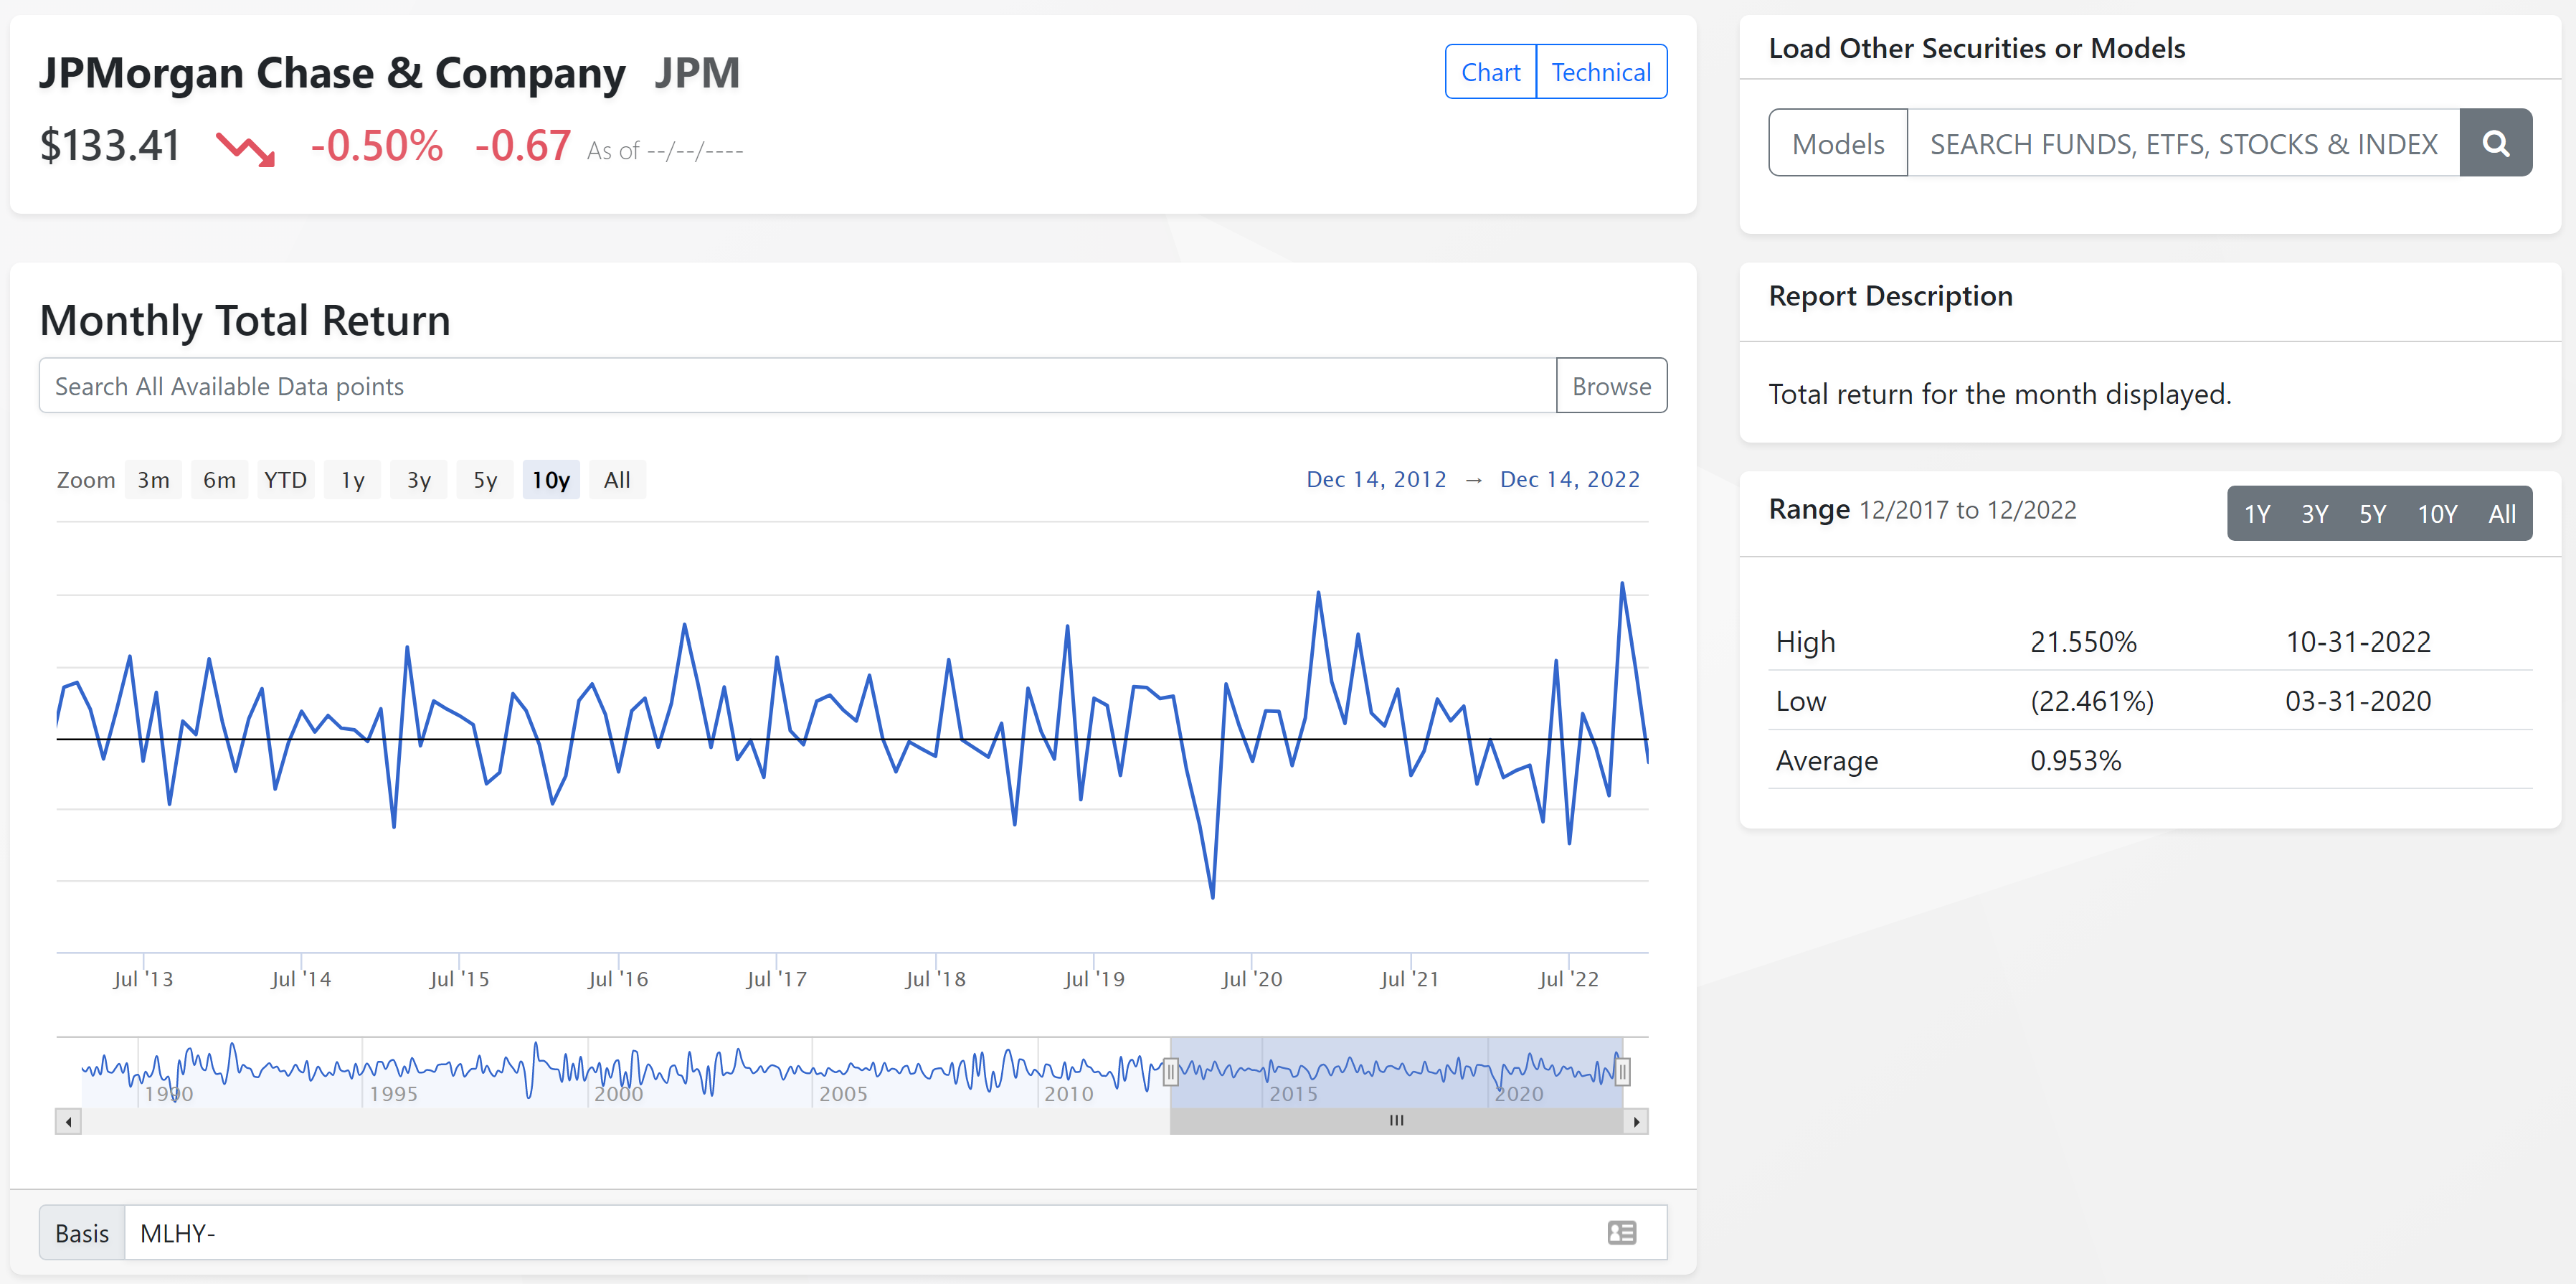
Overview
Use this page to view, download, and analyze the history returns, statistics, and other metrics for Stocks, Funds, ETFs, and your saved models.
Use this data for deep dives, investor presentations, trend analysis, and more.
Available Statistics and Returns
Click the "Browse" button in the center right to view all available metrics.
Metrics include 1Y, 3Y, 5Y Standard Deviation, Ulcer Index, Correlations, Alpha, Beta and more.
Additionally, various metrics are calculated using daily AND monthly total returns. This can be important when analyzing longer term trends or attempting to match FastTrack data with Morningstar (which typically displays data calculated using monthly returns).
Changing Securities/Models
This page can display historical data for securities, indexes, and your saved Static Models, Dynamic Models, and Momentum Models.
Type the security in the search box or click the "Models" button to select the model you wish to display.
Range
This provides summary information on the calculated data. Select different time frame summaries by clicking the dark gray buttons on the upper right.
Basis
Basis the securities used as the basis for calculating risk adjusted return metric, correlations, alpha and beta.
When analyzing bond securities, use bond indexes for the basis. Equity securities use equity indexes, etc.