Transform Your Investment Strategy with Our Spreadsheet Tool
Discover, Compare, and Optimize Your Investments
Unlock the full potential of your investment strategy with our cutting-edge spreadsheet tool, designed to help you screen for the top-performing securities, portfolios, or indexes from a vast database of thousands of metrics. Whether you're evaluating ETFs, mutual funds, stocks, indexes, or custom portfolios, our platform empowers you to combine them all in one place for unparalleled analysis.
FastTrack Your Analysis
Our platform intelligently segments our database into "Families" of securities, based on sectors, indexes, and numerous other criteria. This streamlined approach simplifies the evaluation of thousands of financial metrics, allowing you to rank your results efficiently and effectively.
Why Choose Our Spreadsheet Tool?
Fast and Efficient Analysis: Leverage the FastTrack feature to instantly categorize our extensive database into "Families" of securities. Whether you're analyzing by sector, index, or other criteria, you're equipped to evaluate thousands of financial metrics effortlessly. This isn't just a spreadsheet; it's your shortcut to informed investment decisions.
How It Works
Simplified Data Visualization
- Row Per Ticker: Each ticker is allocated a row, with each column displaying a specific statistic or data point for that ticker over your selected time period.
- Dynamic Sorting: Click on any column header to sort data ascending or descending, helping you prioritize the metrics that matter most.
- Easy Customization: Remove or add tickers with a simple click, tailoring the spreadsheet to your specific analysis needs.
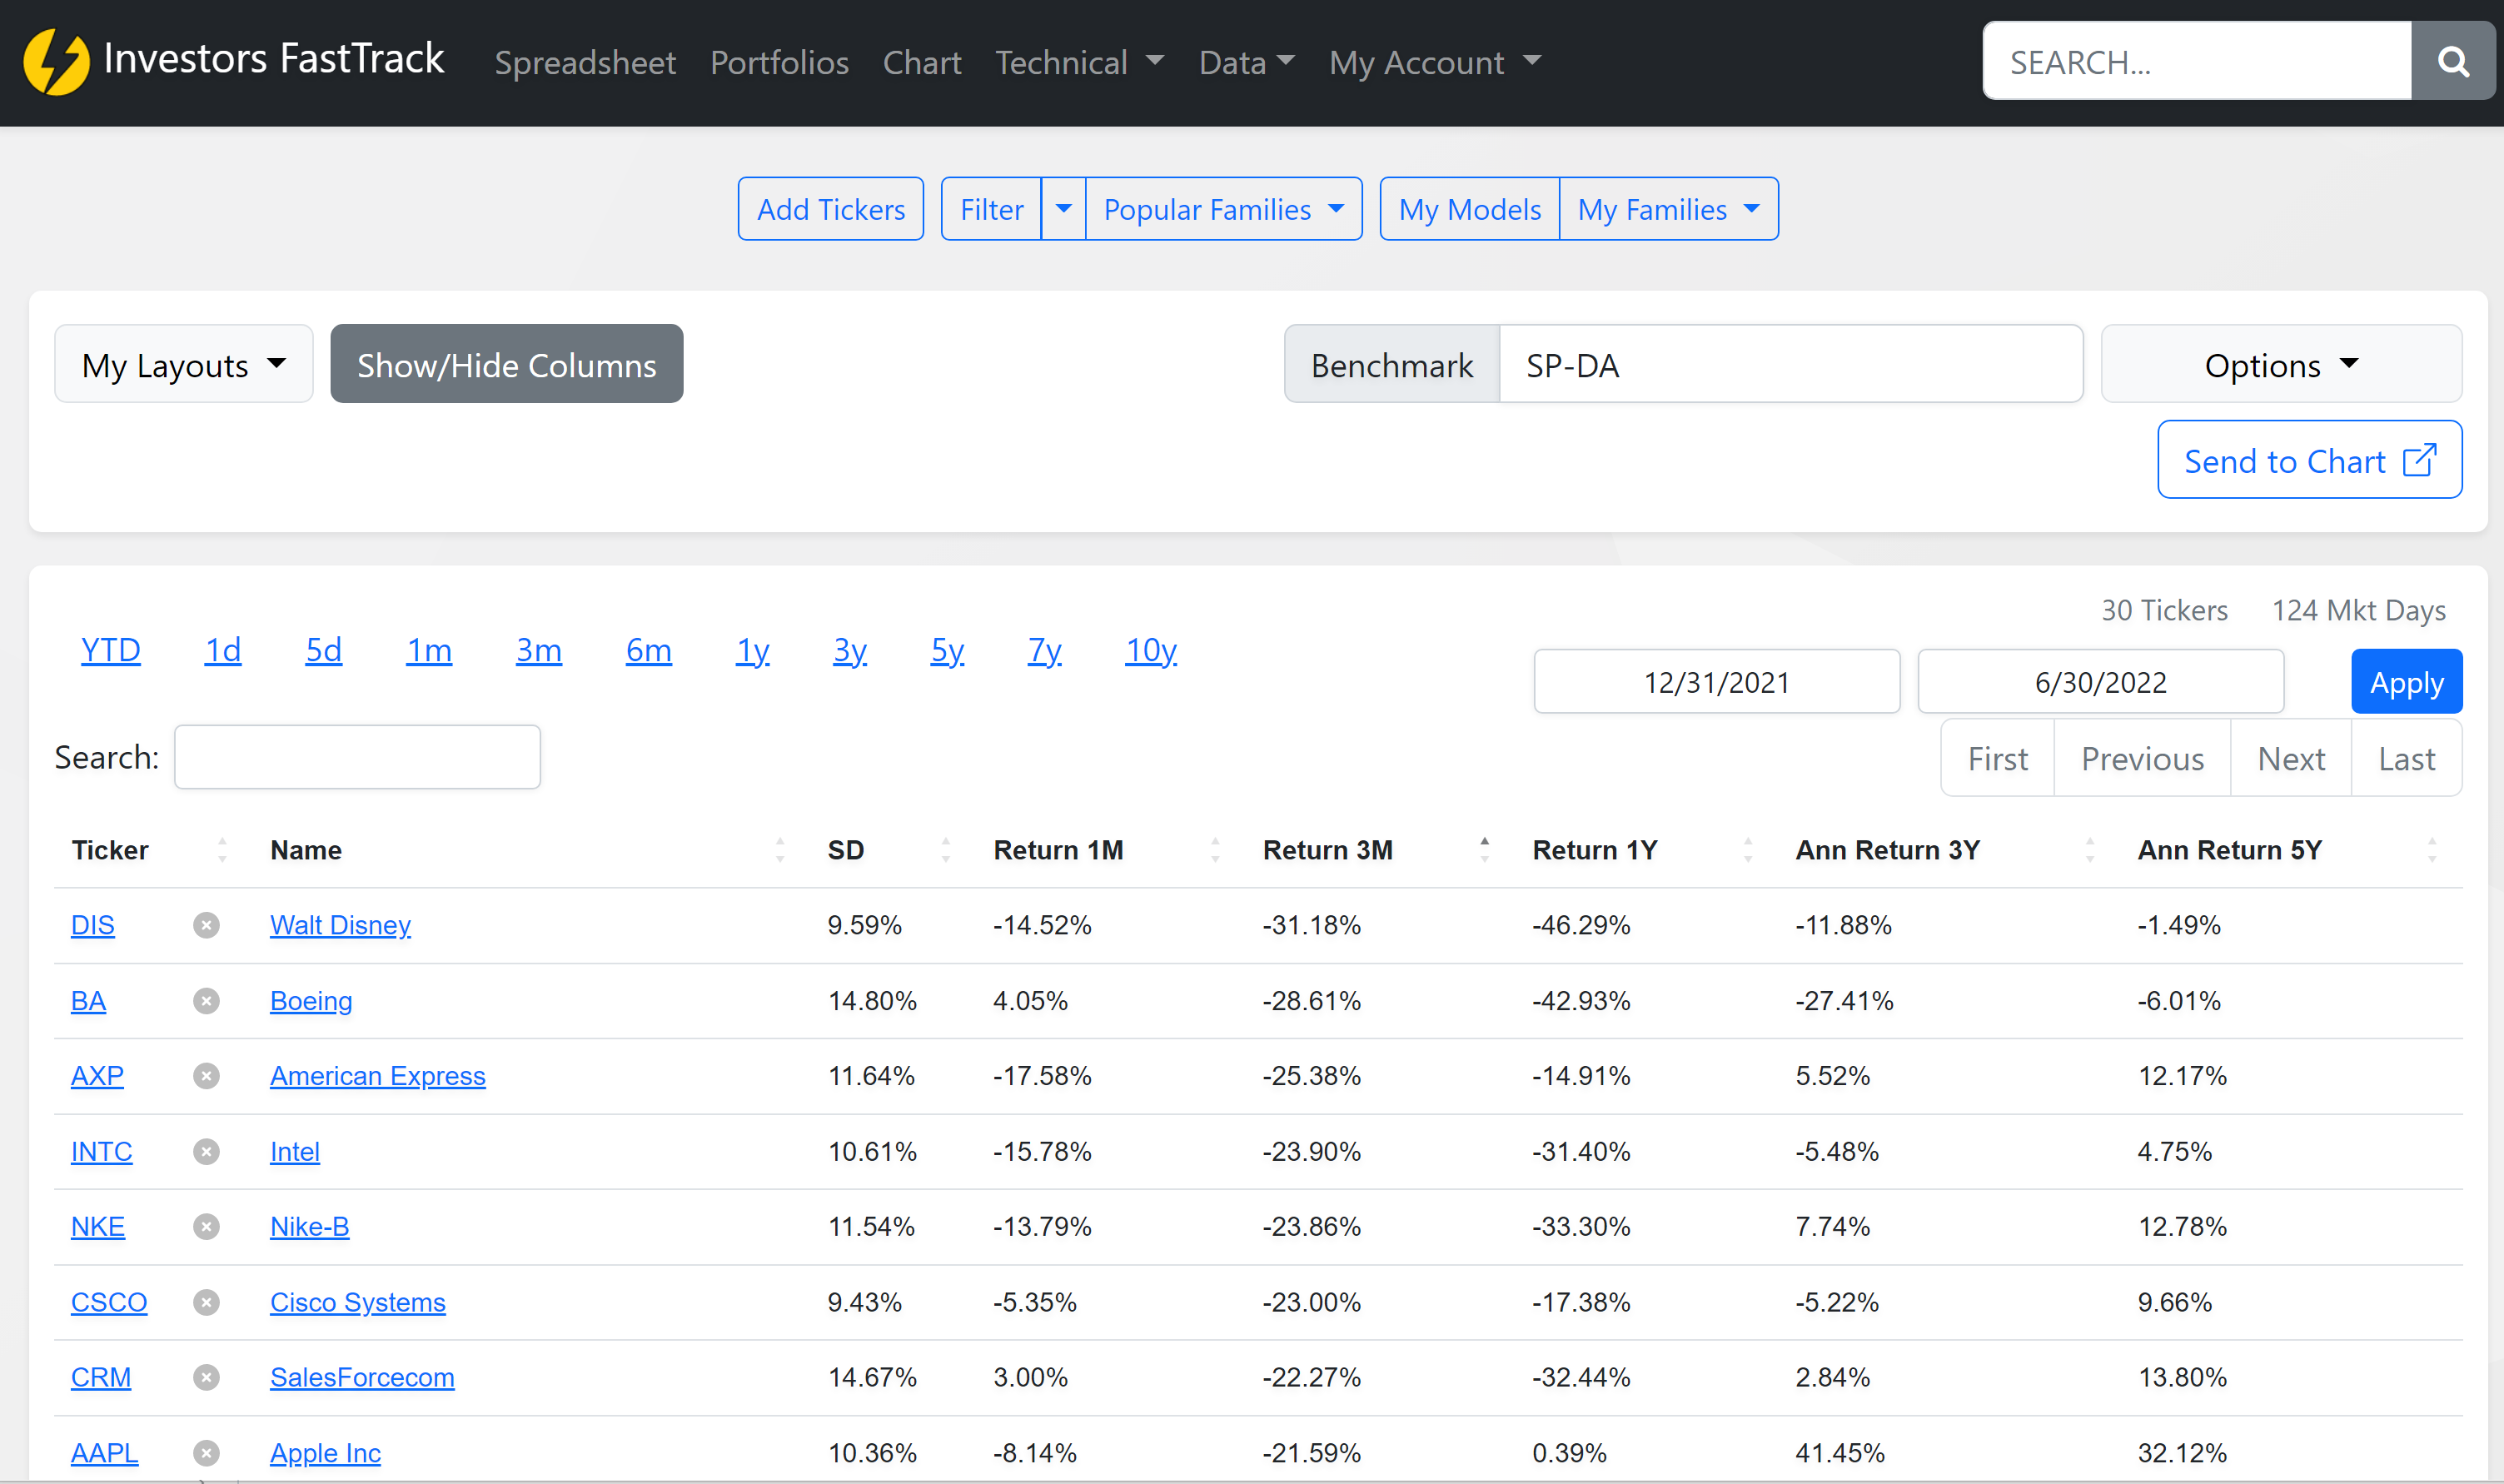
In the example above, "SD" represents the Standard Deviation over a selected period, showcasing our tool's capability to provide deep insights at a glance.
Features Designed with Investors in Mind
Comprehensive Data at Your Fingertips
Each ticker occupies a single row, with columns revealing a wealth of statistics or data points for each ticker over your chosen timeframe. Want to see which investments are outperforming the rest at a glance? Simply click the column header to sort your data instantly.
Add Tickers Seamlessly
Quickly add new tickers or refresh your spreadsheet, with options to clear existing data or merge new tickers seamlessly into your analysis.
Customizable Viewing Experience
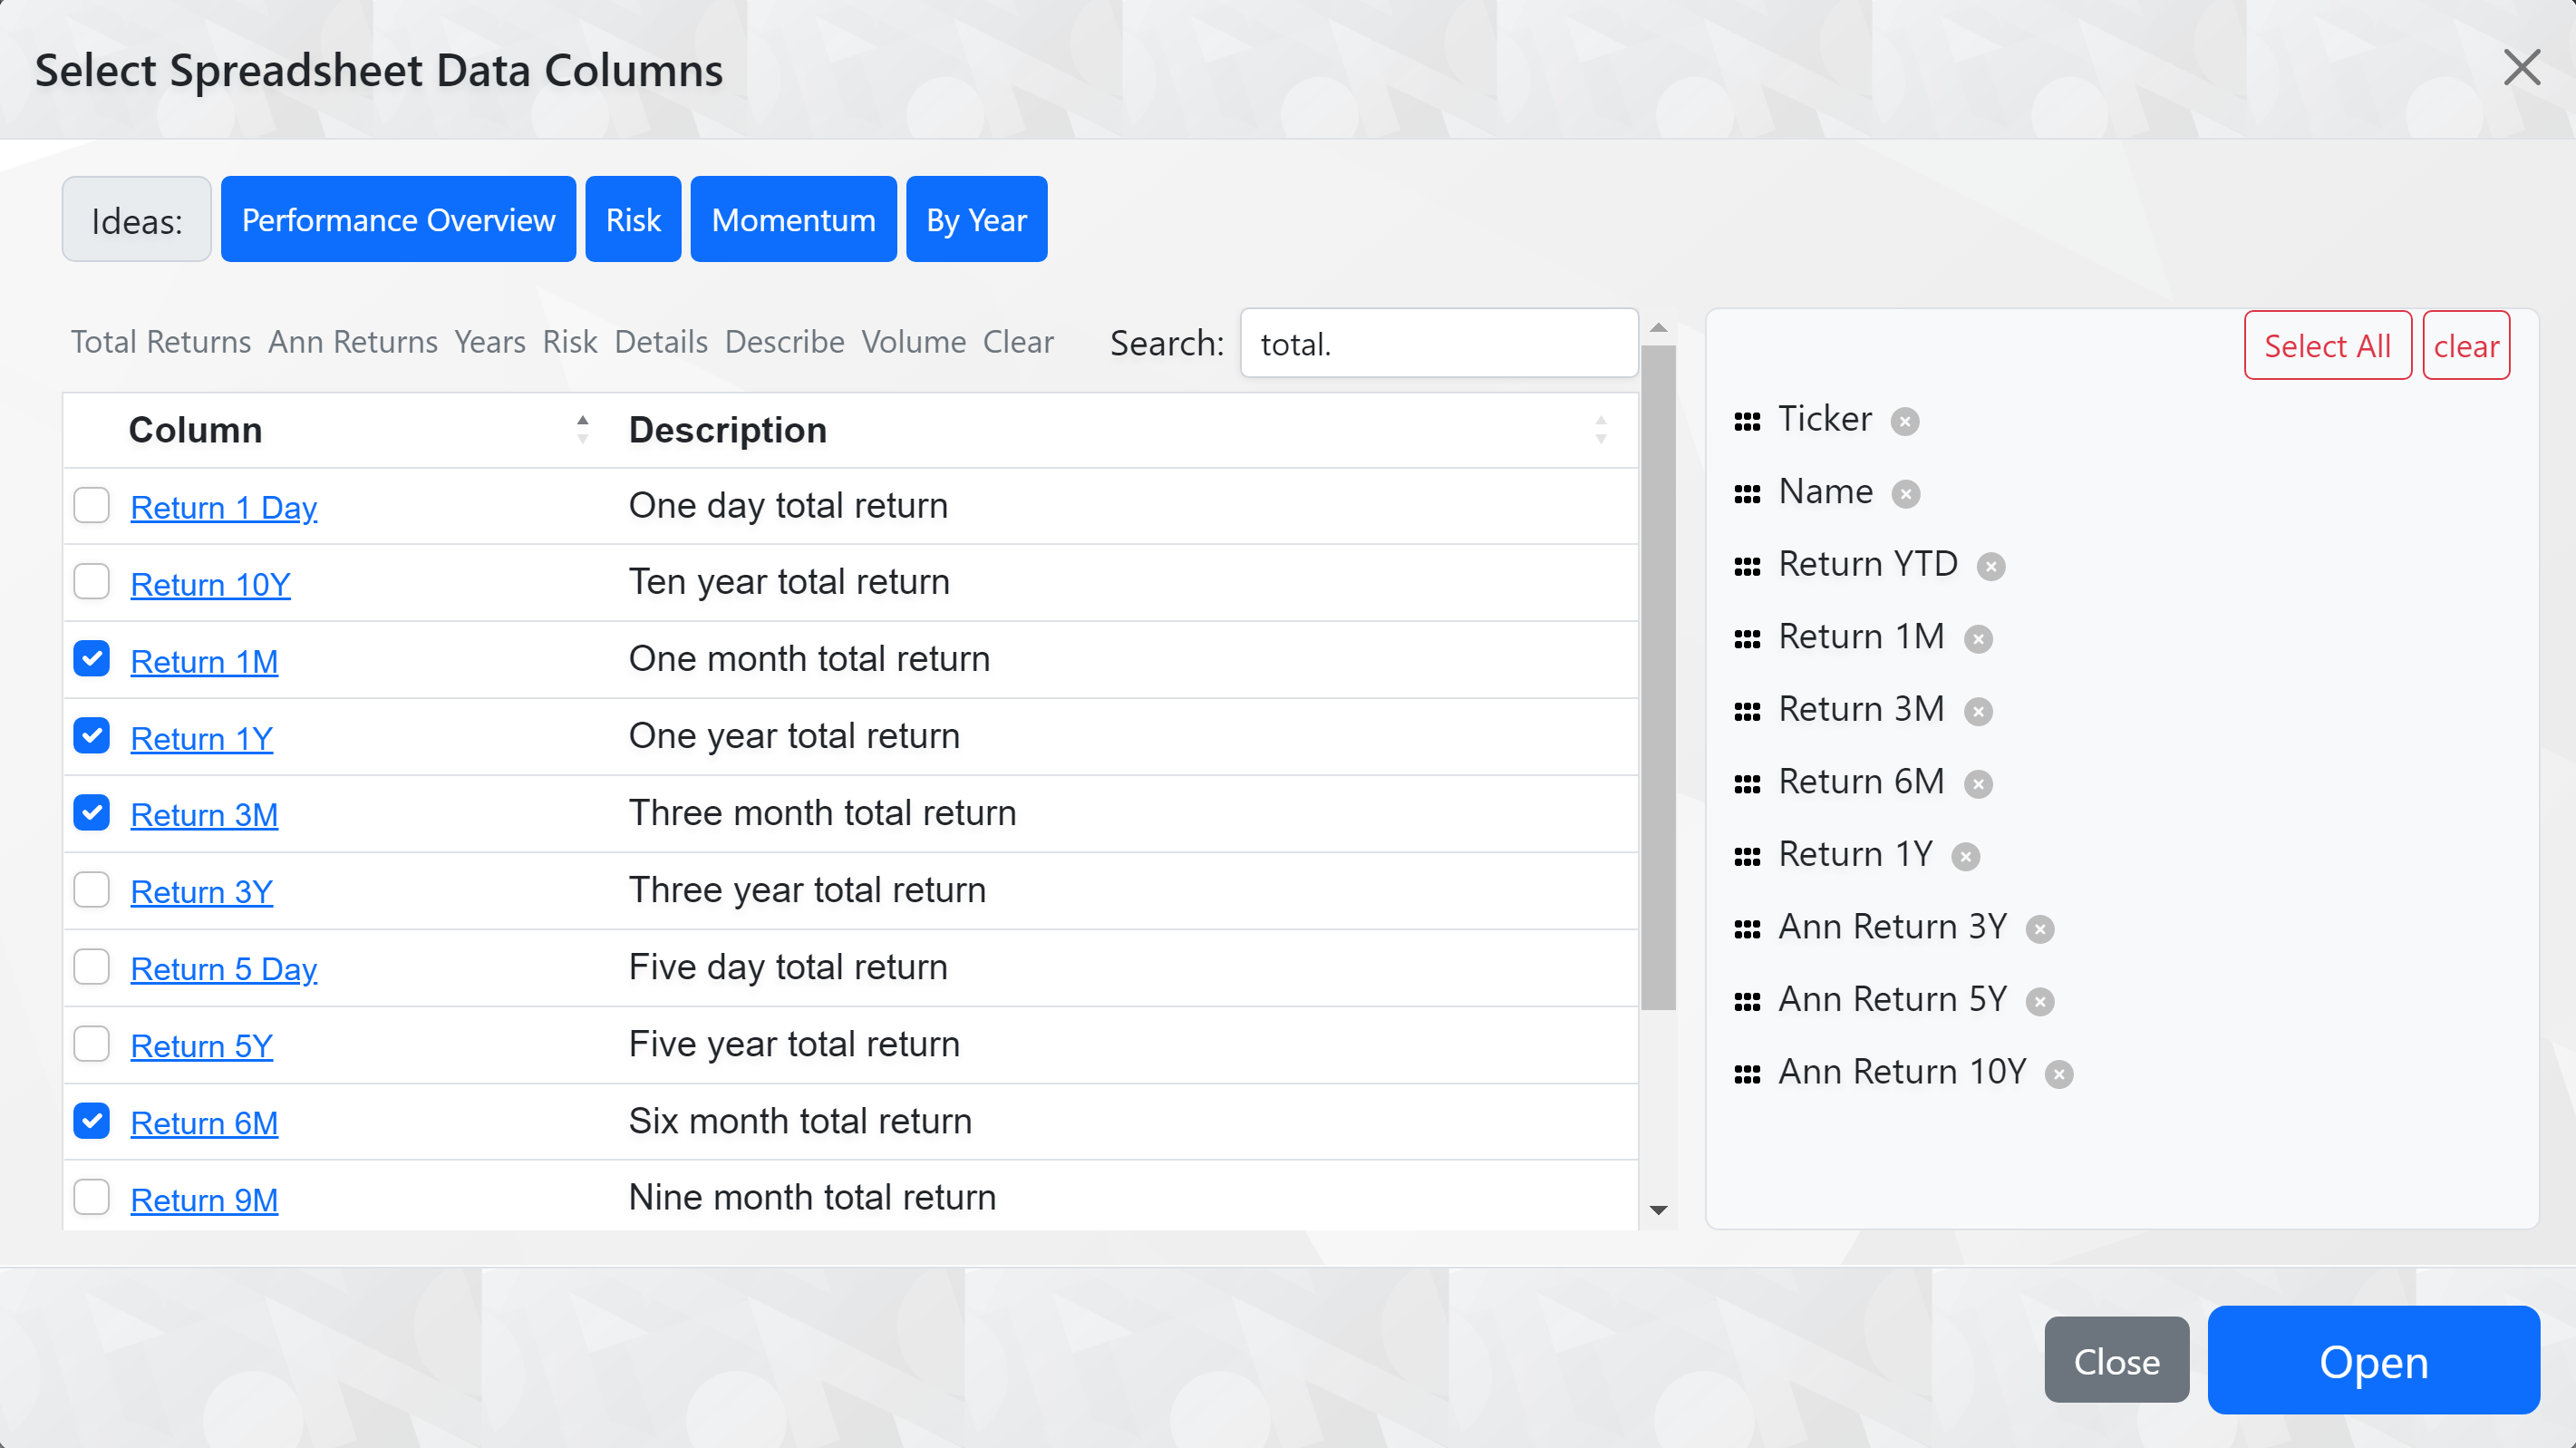
With access to hundreds of metrics, our "Show/Hide Columns" feature lets you curate the data that's most relevant to your goals. Our intuitive interface, including the "Ideas" button, offers popular column configurations to get you started.
Filter for Precision
Drill down into the data that aligns with your investment criteria using our robust filtering options. Combine, mix, and intersect various families to create a custom ticker list that meets your unique analysis needs.
Turn Insights into Action
Save and Recall Layouts
Your investment analysis isn't one-size-fits-all, and neither is our tool. Save your preferred layouts—including columns, order, and tickers—for quick access in future sessions. It's about making our tool work for you, saving you time and enhancing your analysis process.
Model Building Suite
Dive into our powerful suite of model-building tools to rank your model portfolios alongside any other security or model in our database. It's about more than just tracking; it's about strategizing and forecasting your next big investment move.
Personalized "Families"
With thousands of prebuilt families at your disposal, you have the freedom to create and save your own unique groups of ticker symbols. This customization extends to keeping your preferred spreadsheet layout and date range consistent, even when loading new families.
Maximizing Your Investment Strategy:
Date Range Precision: Tailor your analysis with specific start and end dates to understand how securities have performed over time. This detail isn't just about historical data; it's about spotting trends and making predictions that can shape your investment strategy.
Advanced Options for the Savvy Investor: From setting the perfect correlation length to adjusting moving averages for nuanced analysis, our advanced options give you the control to refine your investment approach.
Elevate Your Investment Game
Our spreadsheet tool isn't just about managing data; it's about unlocking the full potential of your investment strategy. By combining user-friendly design with powerful analytical capabilities, we offer you a platform that not only meets your investment needs but also propels you towards your financial goals.
Ready to transform the way you analyze investments? Join us and discover how our innovative platform can elevate your investment strategy today.